
The Monday Stalk List | Ep. 32

5 Headed Question Mark
b2

Sunday Stalk List | Ep. 32

Welcome back to The Sunday Stalk List. (Monday This Week)

Every weekend, I review hundreds if not thousands of charts across U.S. indices, global markets, breadth, sentiment, and intermarket relationships.

And now I’m opening up my stalk list.

The names that stood out the most from my review.

This Week’s Theme:  5 Headed Question Mark

We know the biggest stocks matter most, especially in a market-cap-weighted index like the S&P 500.

META is in the penalty box, GOOGL keeps running, and that leaves the five in the middle. 

These names represent the bulk of the index’s engine, and right now they’re all sitting at inflection points.

Resolution here will dictate whether this Bull Market begins to slide or starts to thrive again.

Breadth - "The Market of Stocks"

If you missed it, I broke down this dashboard and how I actually use it in my process during my weekly show.


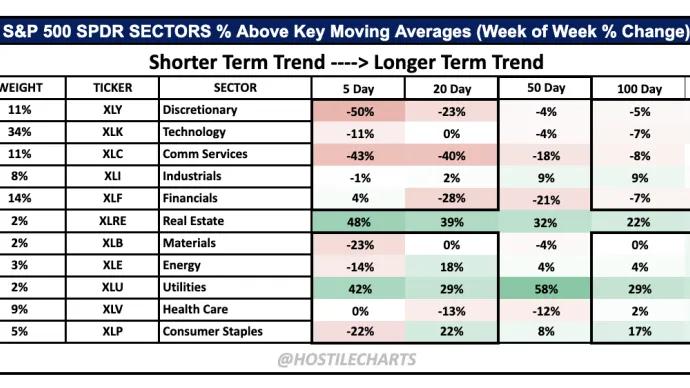
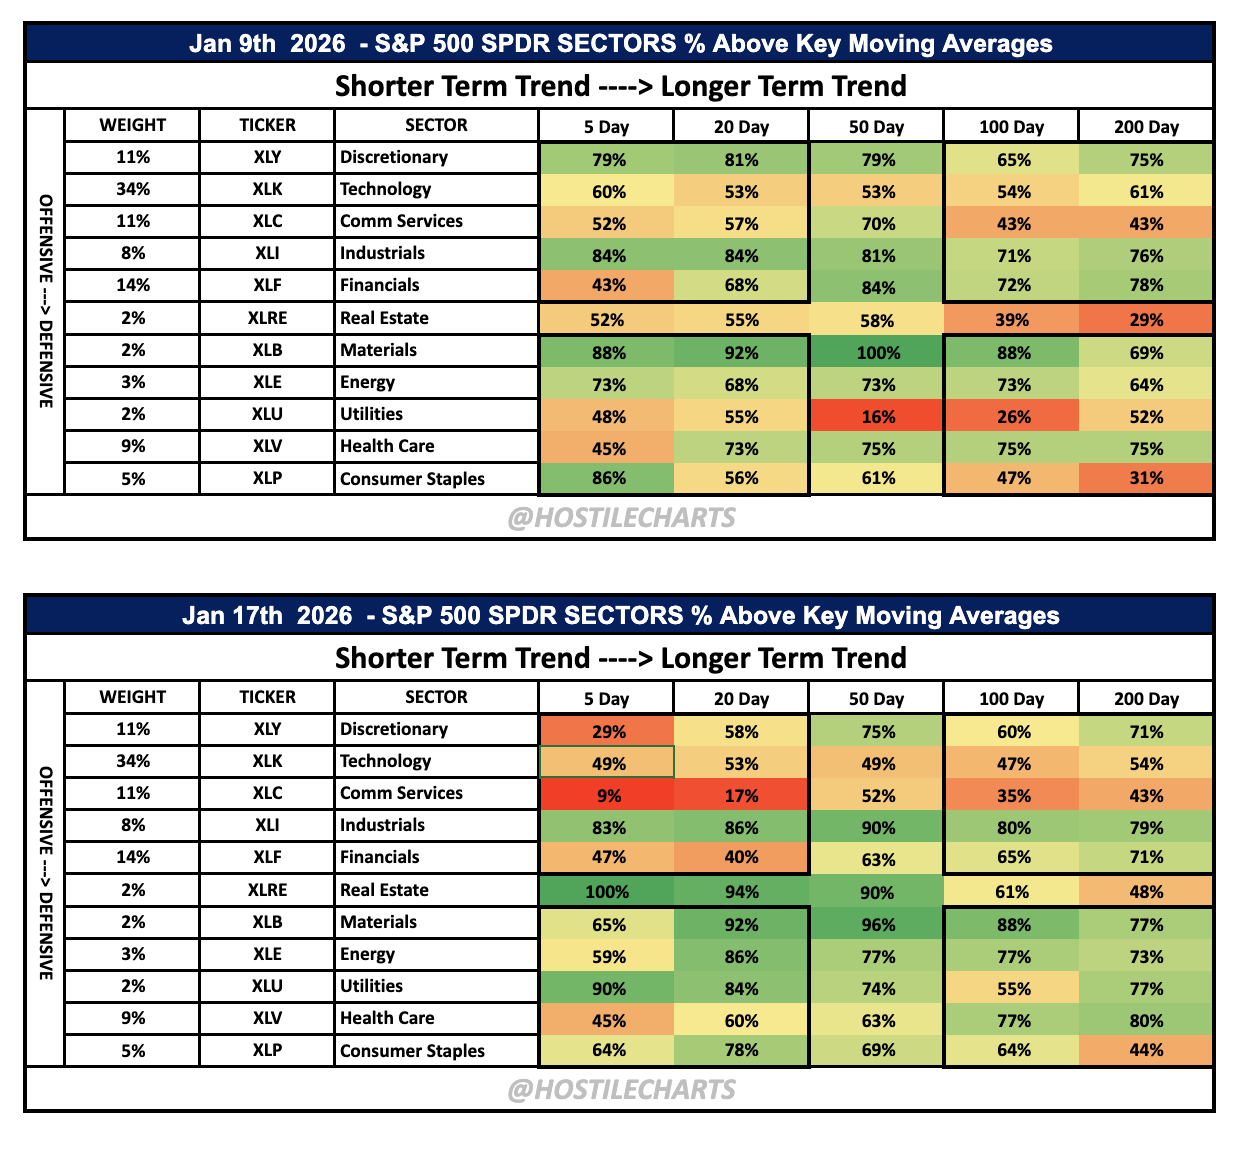
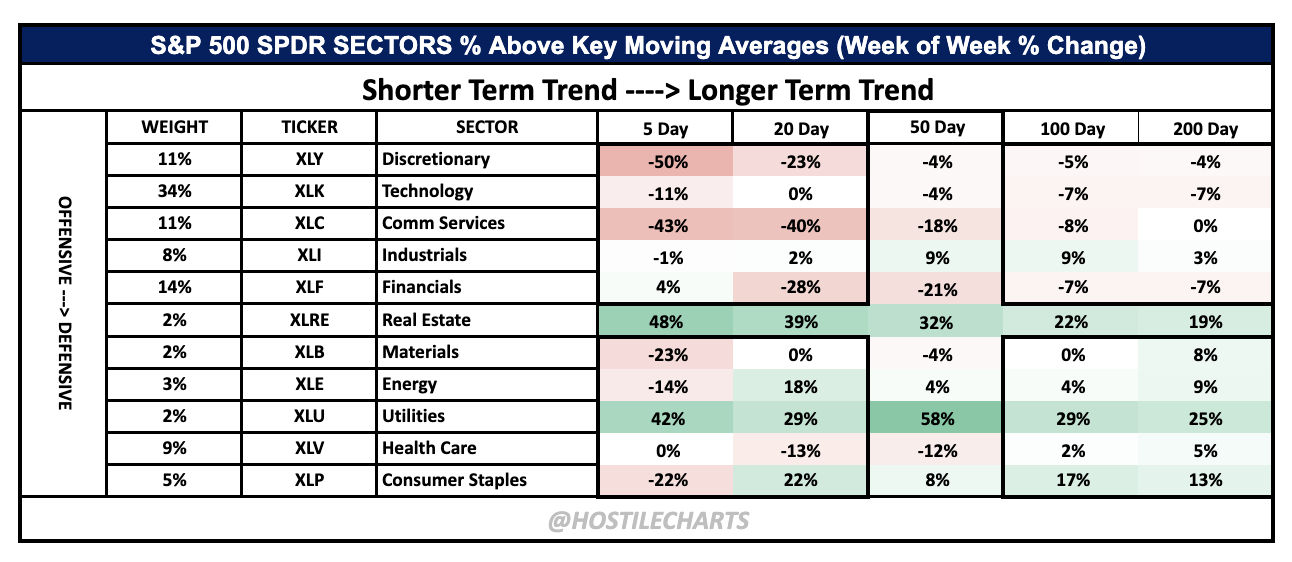
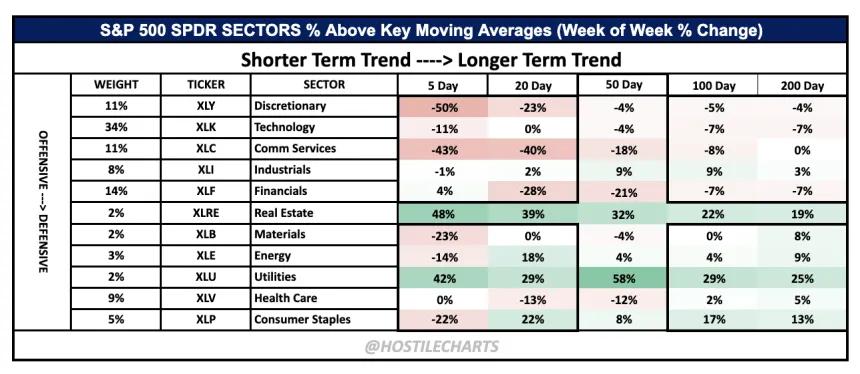
From Jan 9th to Jan 17th, offensive sectors saw sharp short-term cooling, led by Discretionary and Communication Services, while defensive and rate-sensitive areas quietly absorbed capital. The 5-day and 20-day windows reset momentum, but the 100-day and 200-day data continue to support a constructive intermediate-term trend. 

Money didn’t leave the market, it just changed seats.

There are cracks forming, but the ground isn’t shaking yet. The BenchWarmers continue to score points for the team, keeping the broader structure intact but we need the MVP's to wake back up....

The Stalk List 

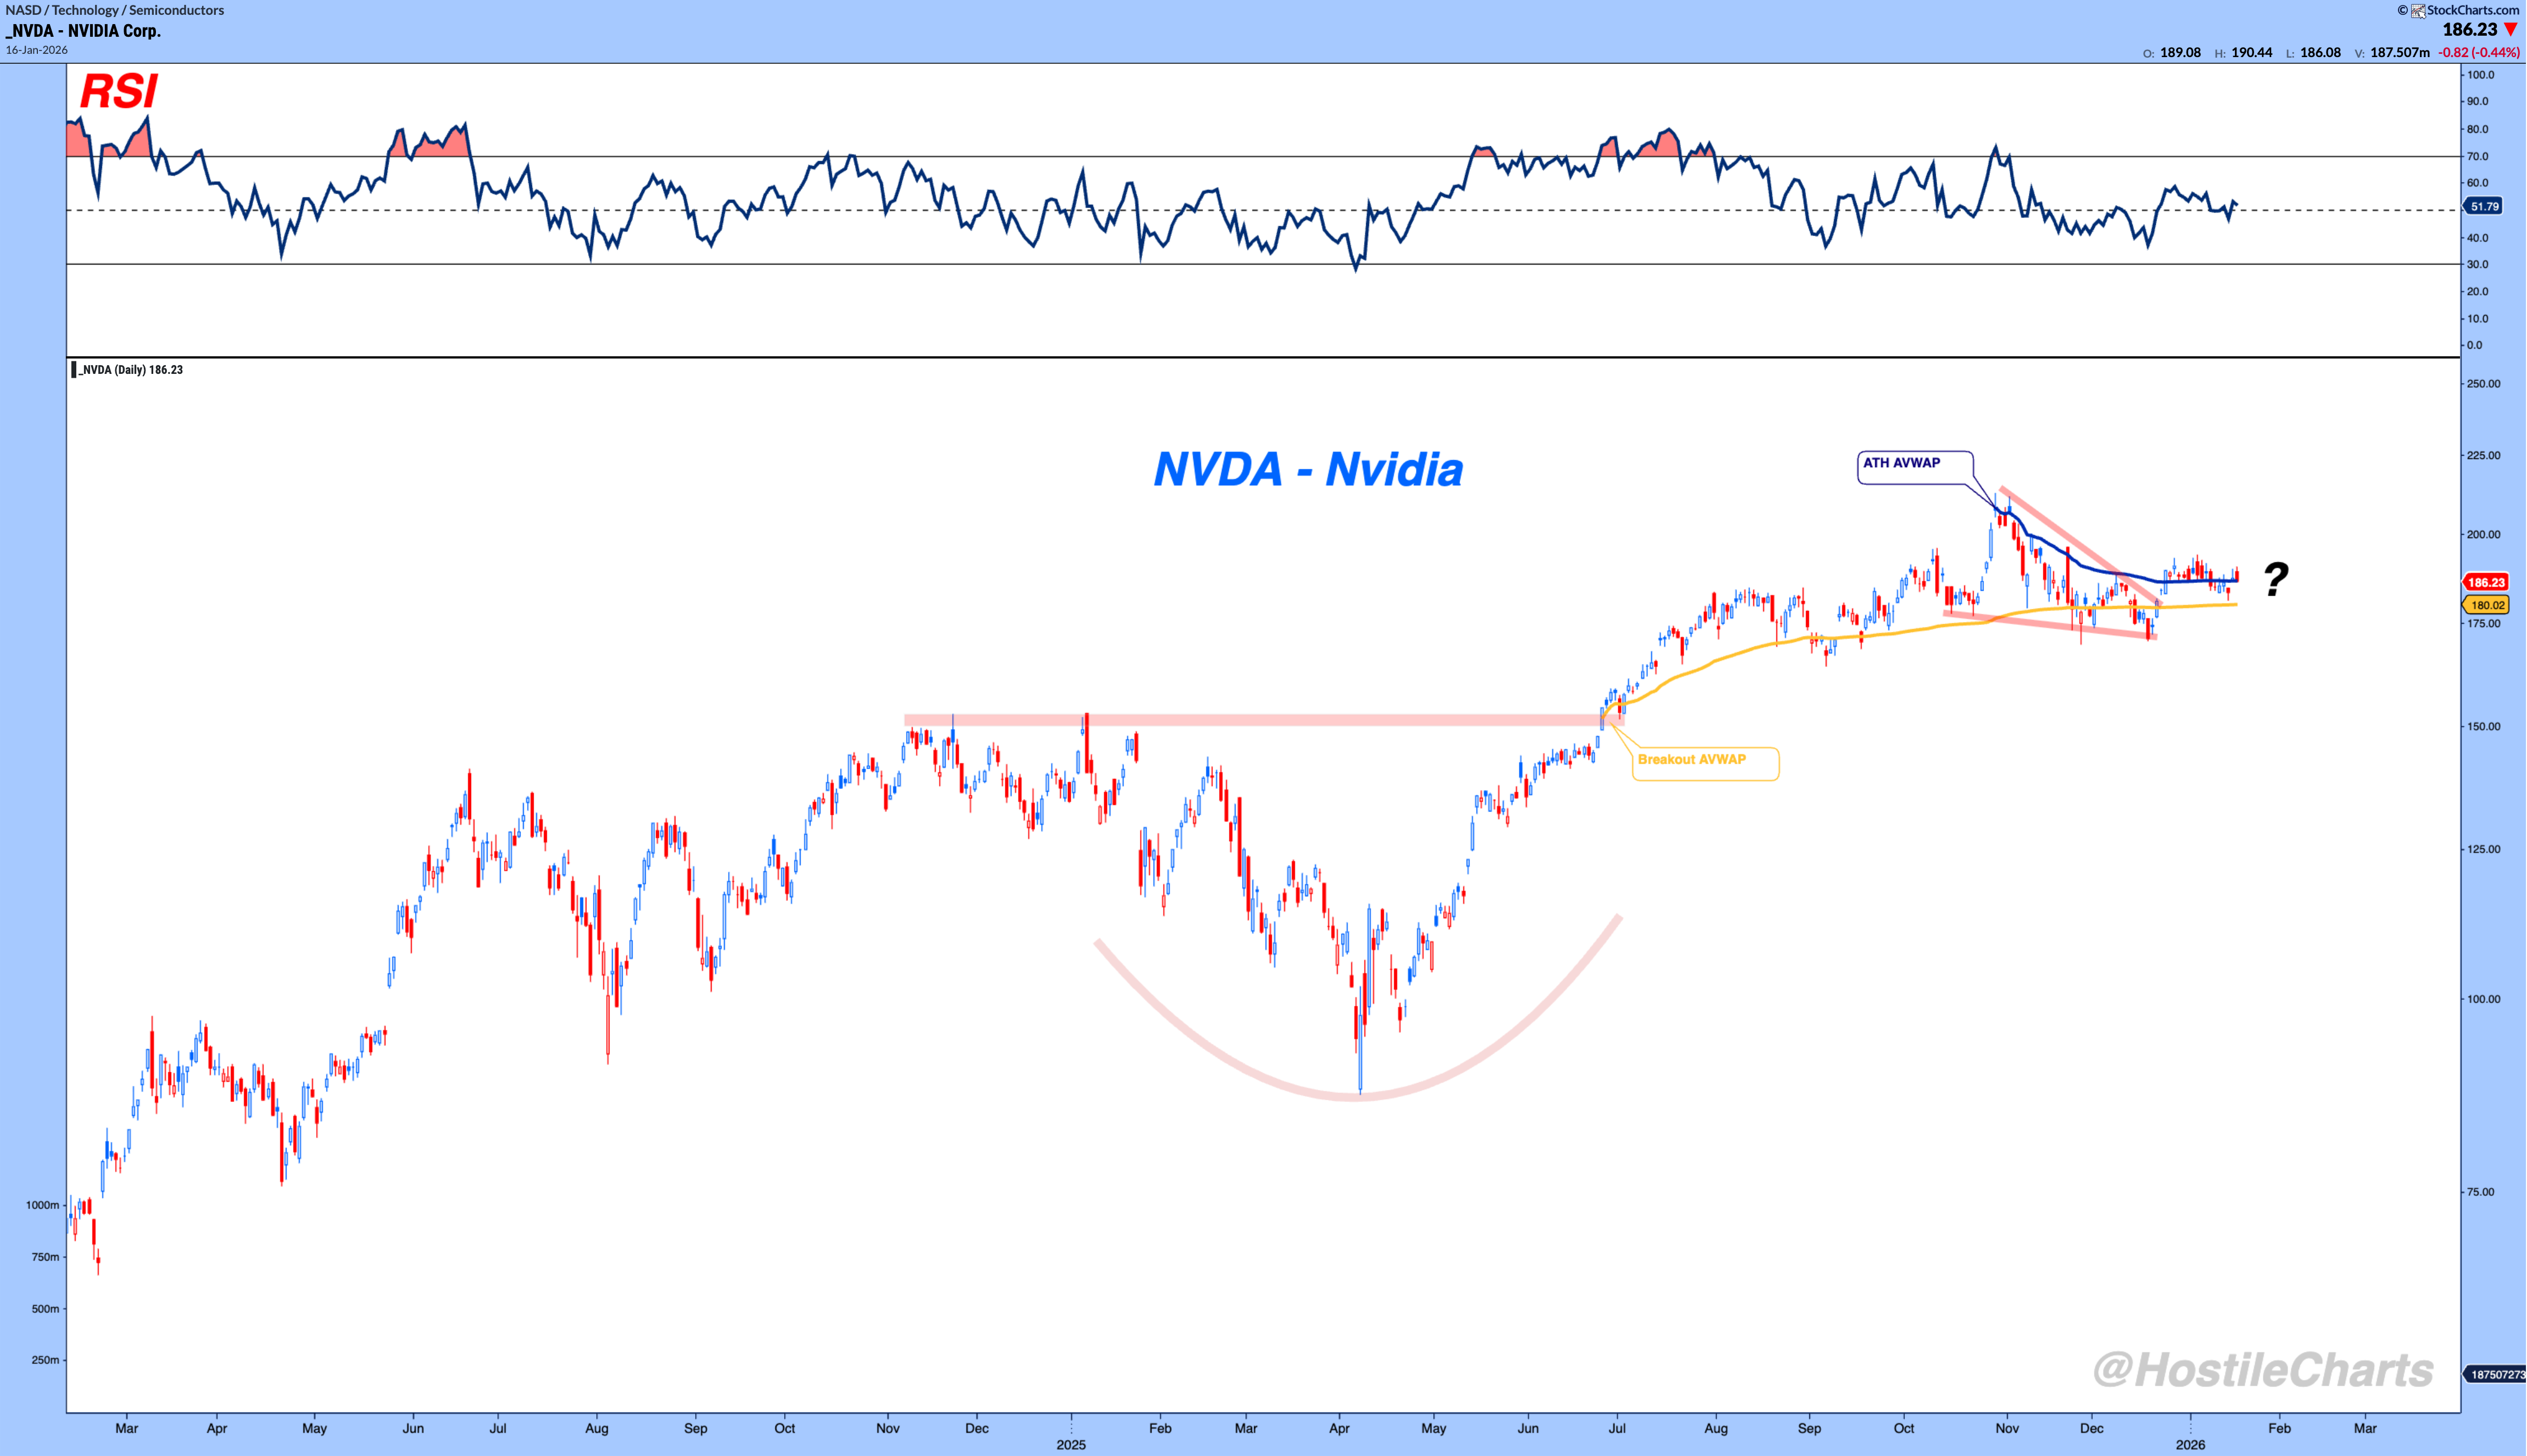
$NVDA - Nvidia | ~7.5% of the S&P 500

Nvidia is digesting, not breaking but it's lagging the semiconductor space as a whole that's already at all time highs. 

Price is consolidating above its breakout AVWAP and just above the rising 200-day, with momentum flattening but intact. 

Holding this range keeps the larger uptrend alive, while losing it would put real pressure on the semiconductor complex.

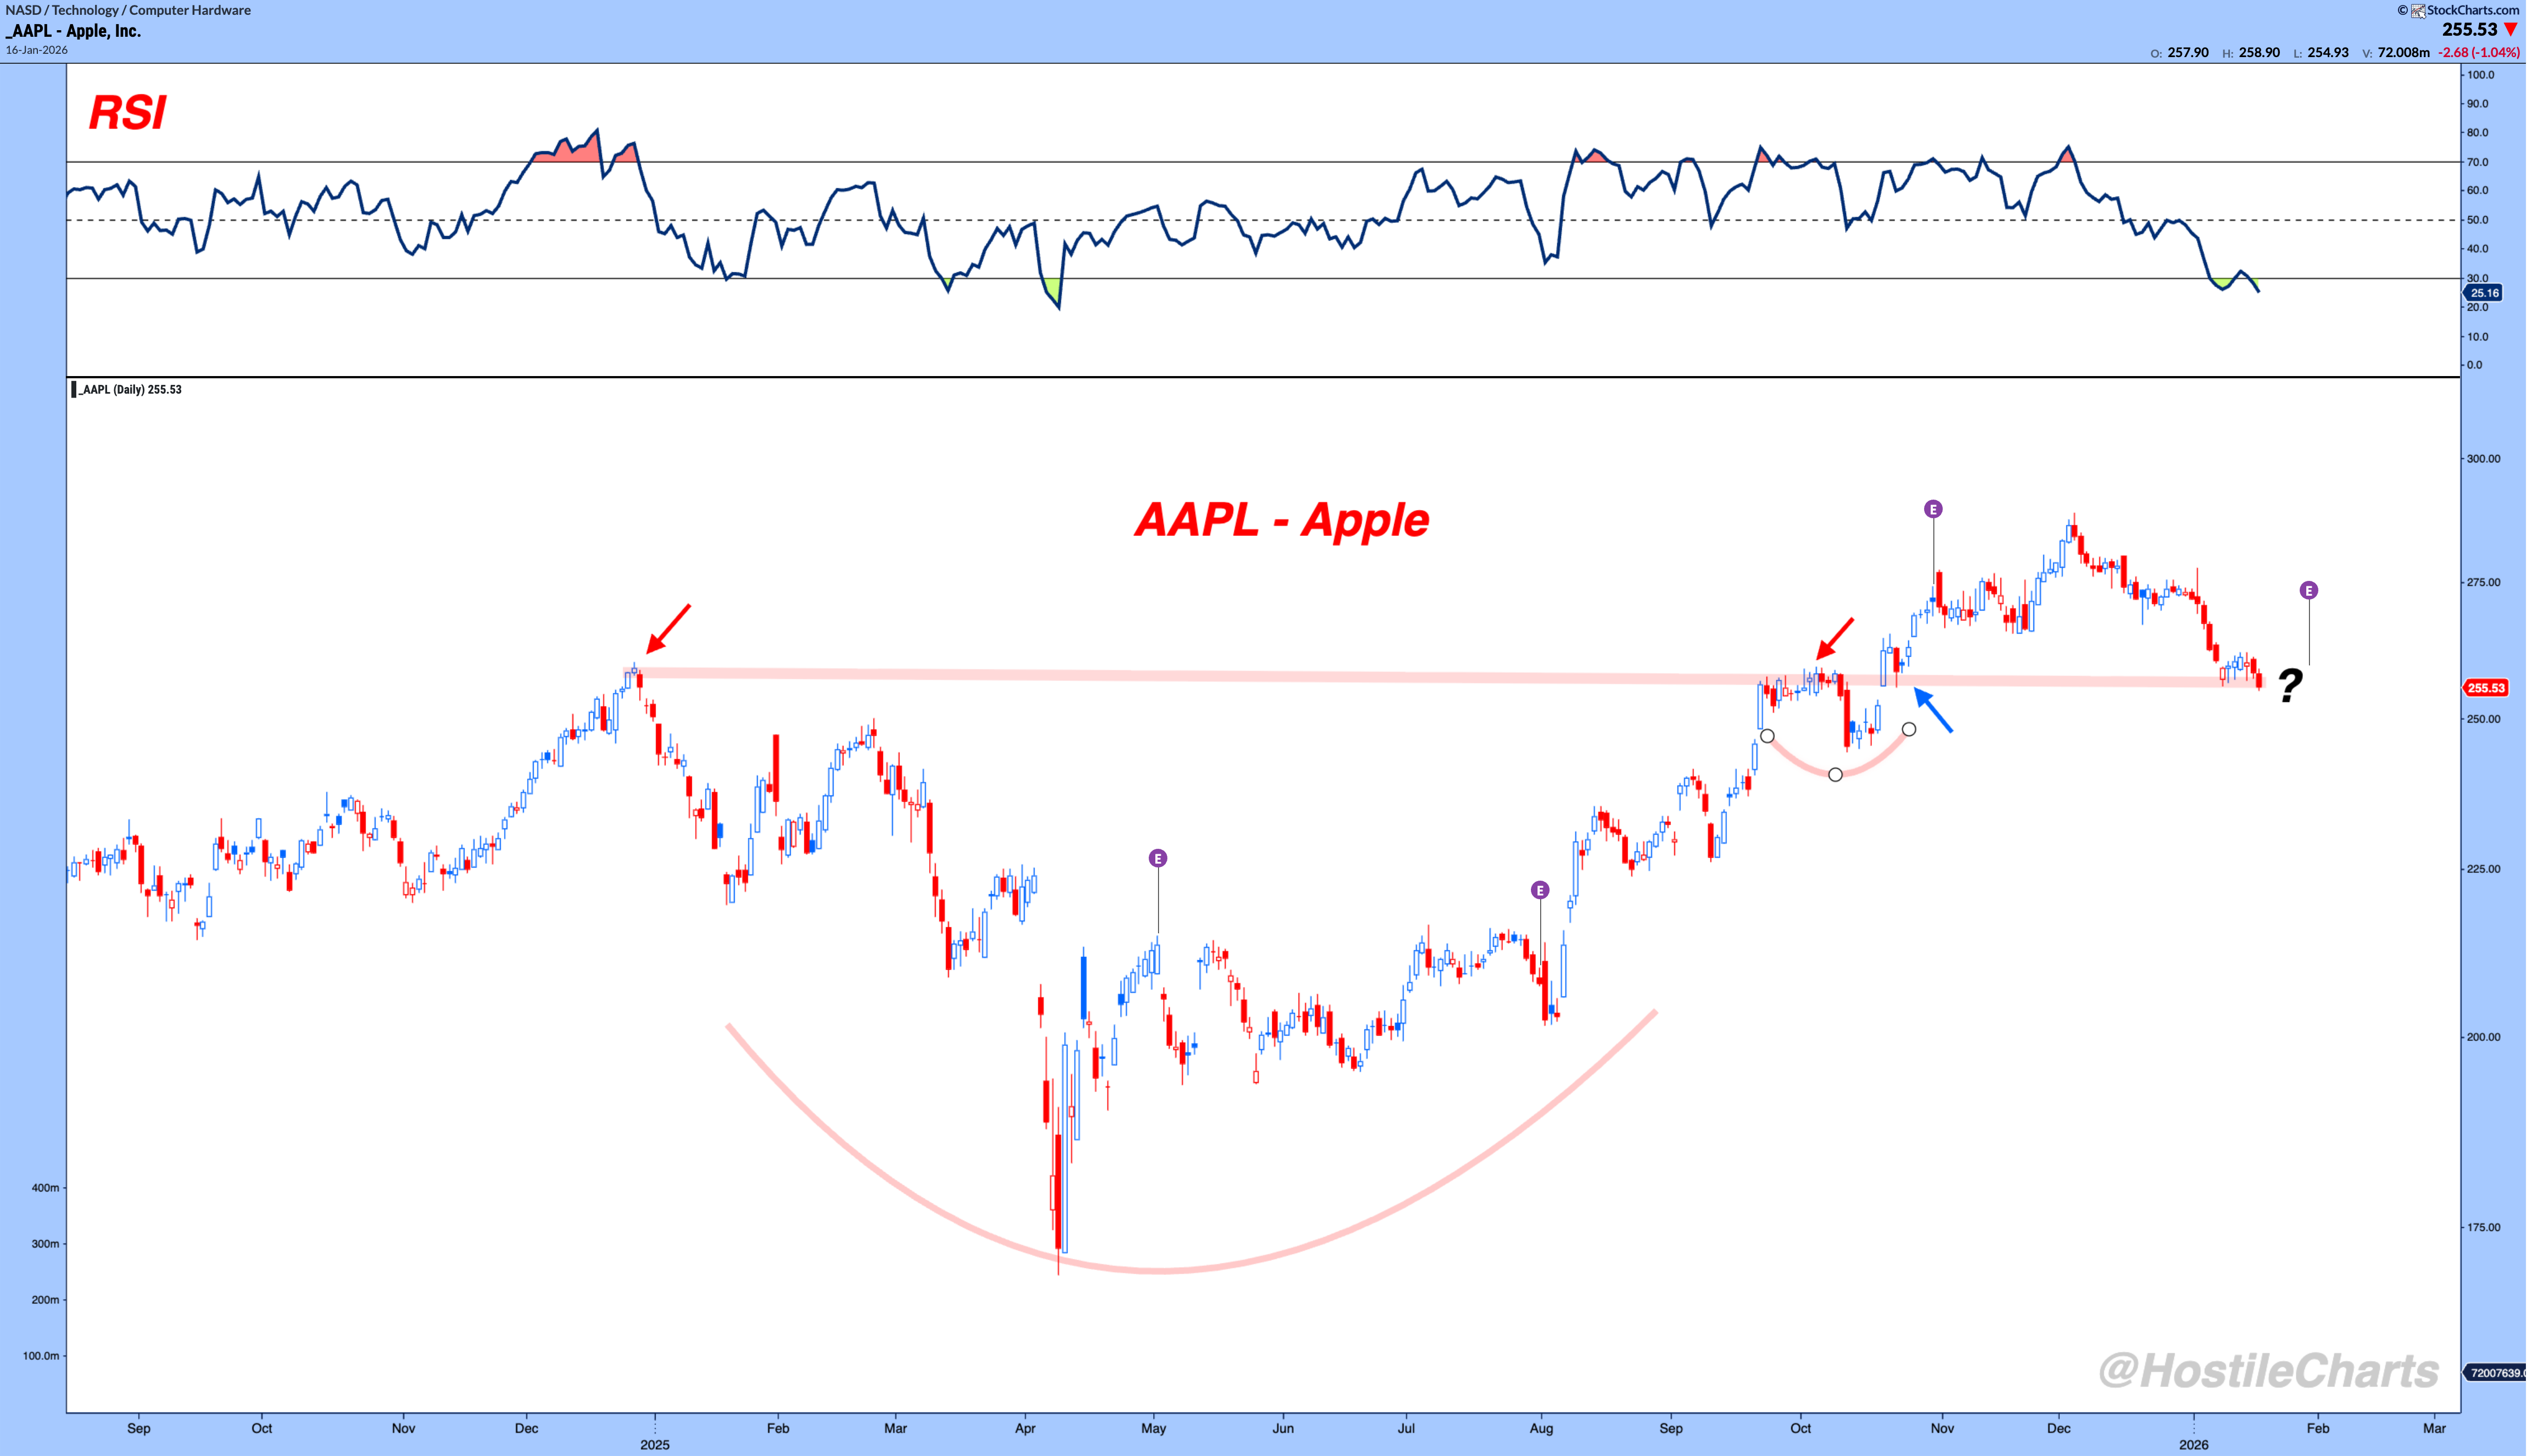
$AAPL - Apple | ~6.5% of the S&P 500 

Honestly, this chart is annoying. Nothing like a clean breakout failing....

The breakout resolved higher and has retraced back into the $255 area, which is the area that matters.

If buyers can hold this level, it puts technology back on stable footing, but losing it turns this back into dead weight.

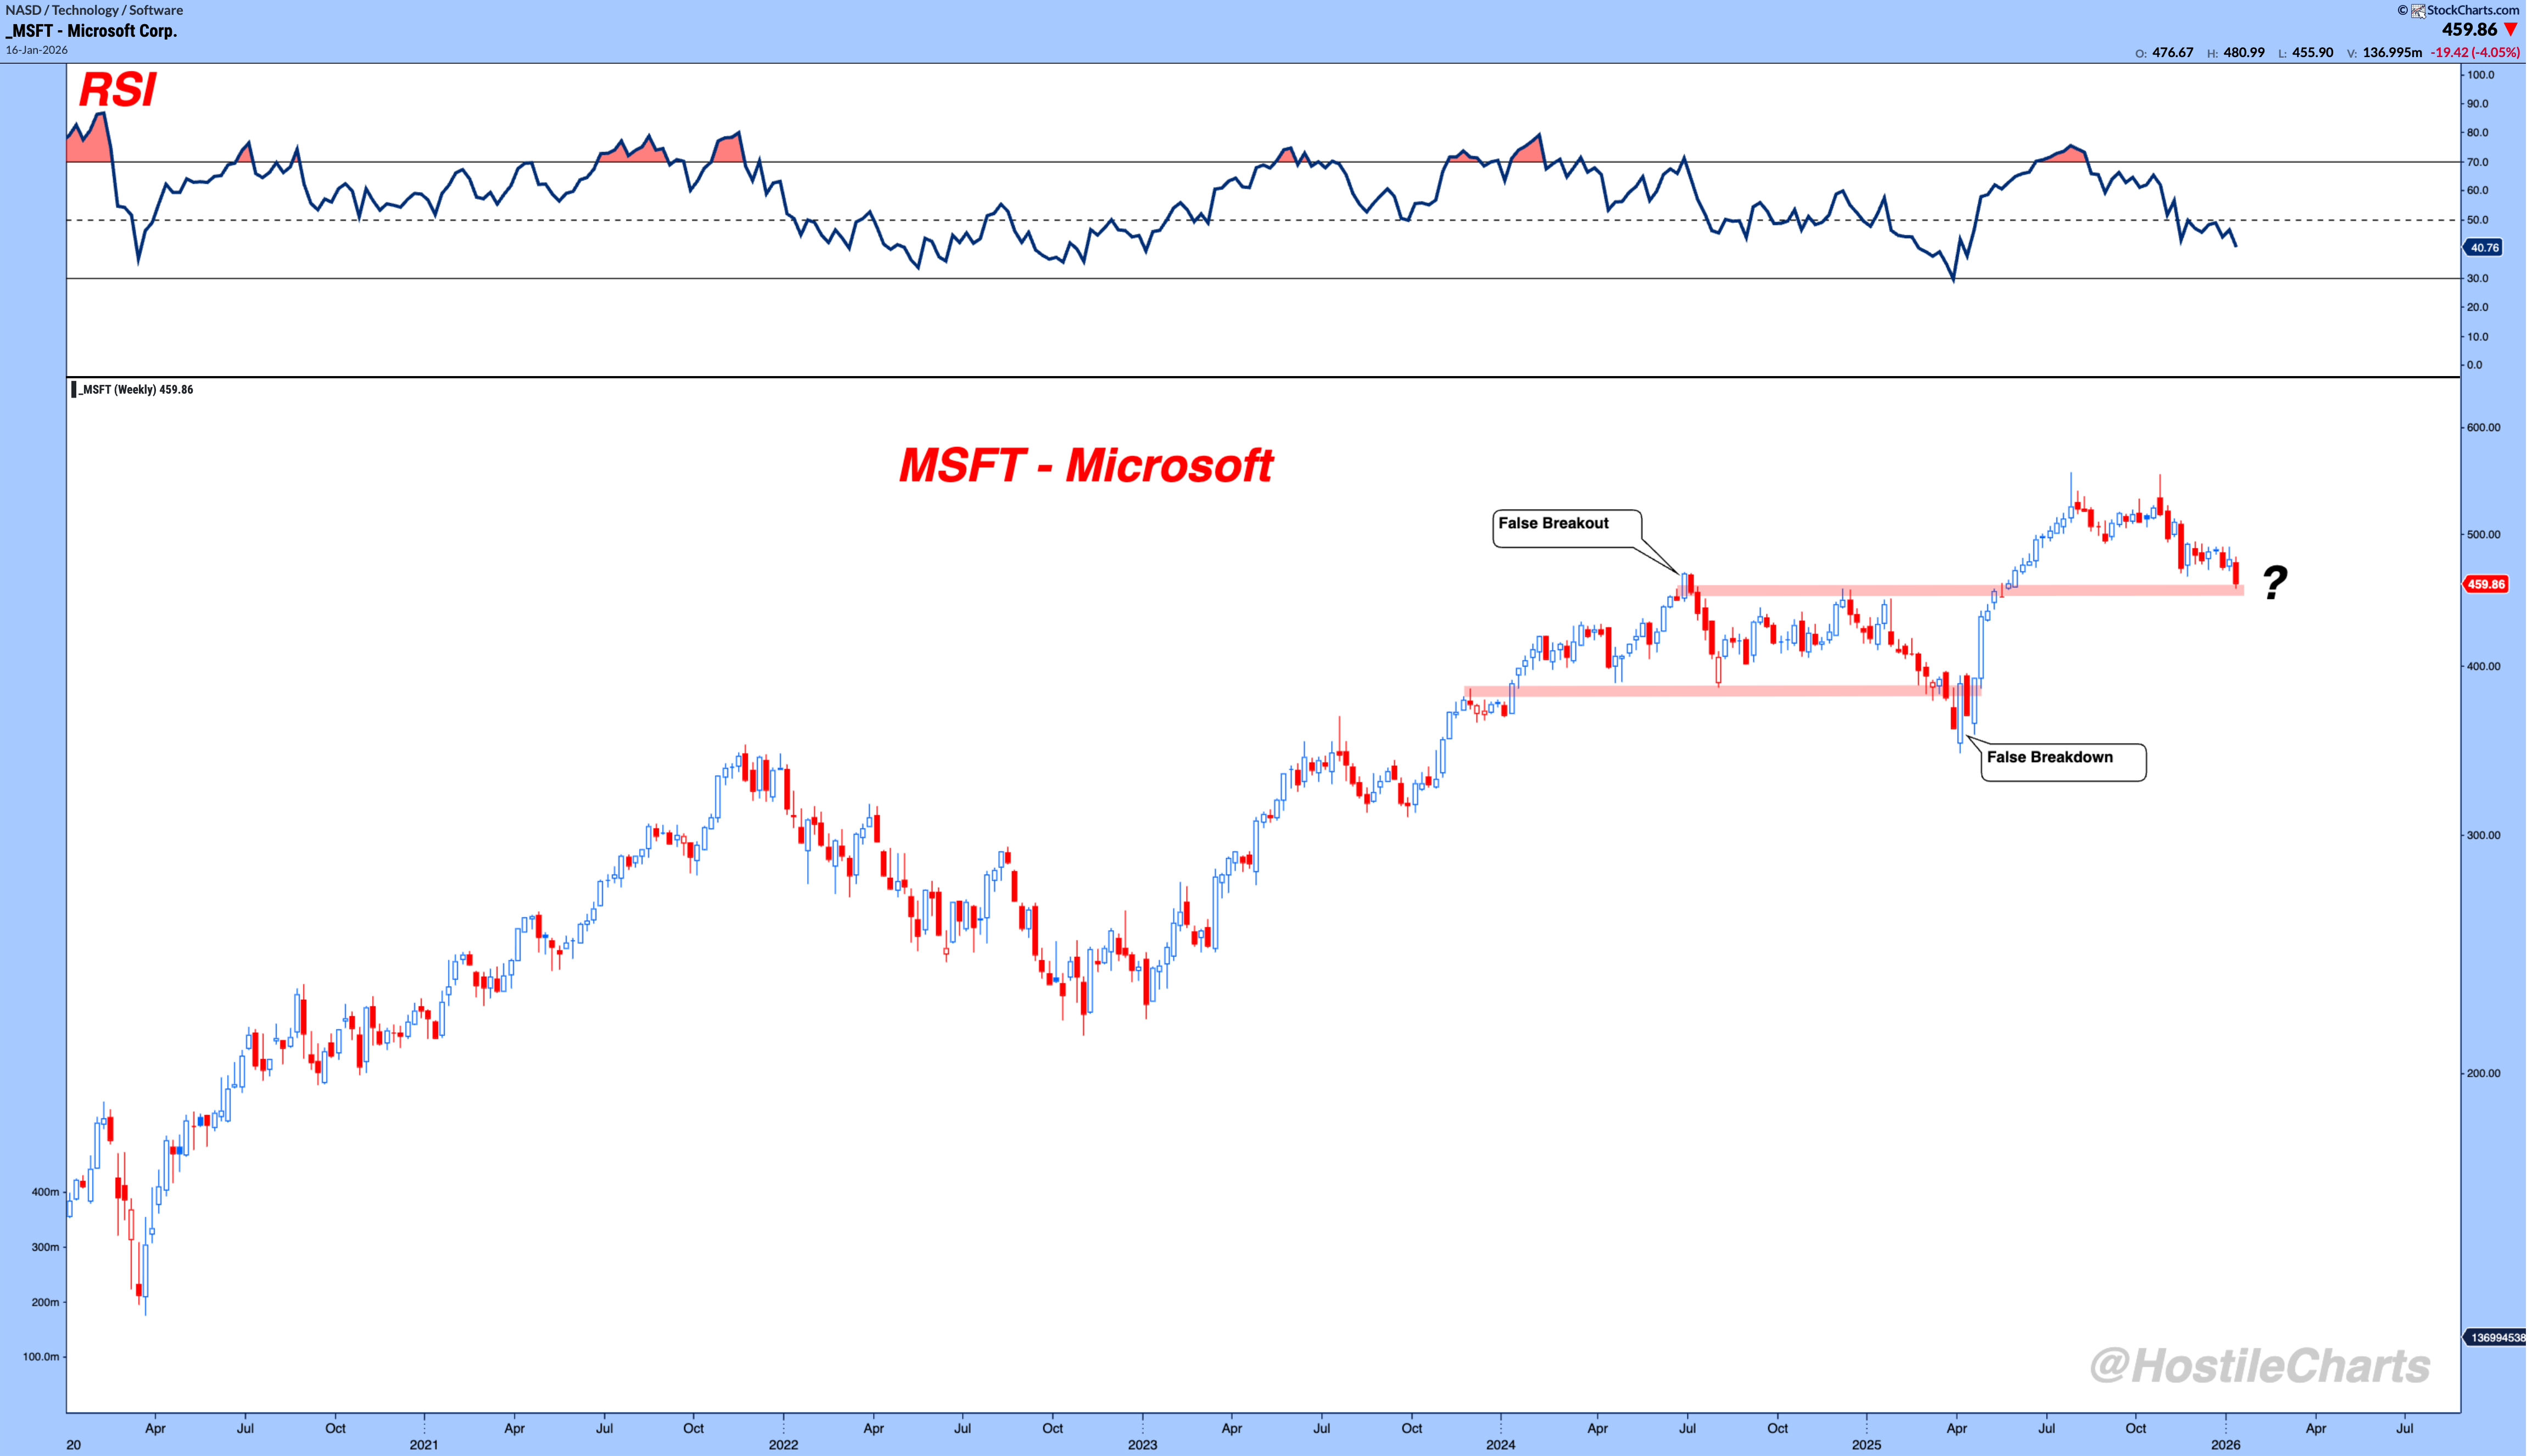
$MSFT — Microsoft | ~5.75% of the S&P 500

Price is compressing just beneath its polarity zone from the mid-2024 highs, it's in real danger here. 

Software as a whole has been a drag on the tech sector and market cap weighted indexes. 

A clean resolution higher from here would go a long way toward stabilizing market-cap leadership.

$AMZN - Amazon | ~4% of the S&P 500 

Amazon is my favorite of the group. 

After a failed breakout, price has reclaimed its all-time high AVWAP and is holding right around $230. 

If we get follow-through this week, this looks like a fresh base breakout rather than a failed move.

$TSLA - Tesla | ~2% of the S&P 500

On a longer-term weekly view, Tesla already broke out and is now moving sideways. 

This is classic consolidation after expansion, but it needs resolution to the upside for market cap to catch up to its recent underperformance.

 A sustained move higher here would add fuel to the broader risk-on narrative.

My Two Cents

These five charts are the question mark for the market right now. 

We’re still in a Bull Market, but for it to persist, the 5 headed monster needs to wake up. 

My Weekly Show - Thompson’s Two Cents

🎥 Thompson Two Cents Live

🚀 Throw it on 1.5x speed and let it rip.

👍 Give it a like. It’s the easiest way to show me some love.  

b2