🔎 Energy is Firmly in the Lead
📊 Daily ETF Overview
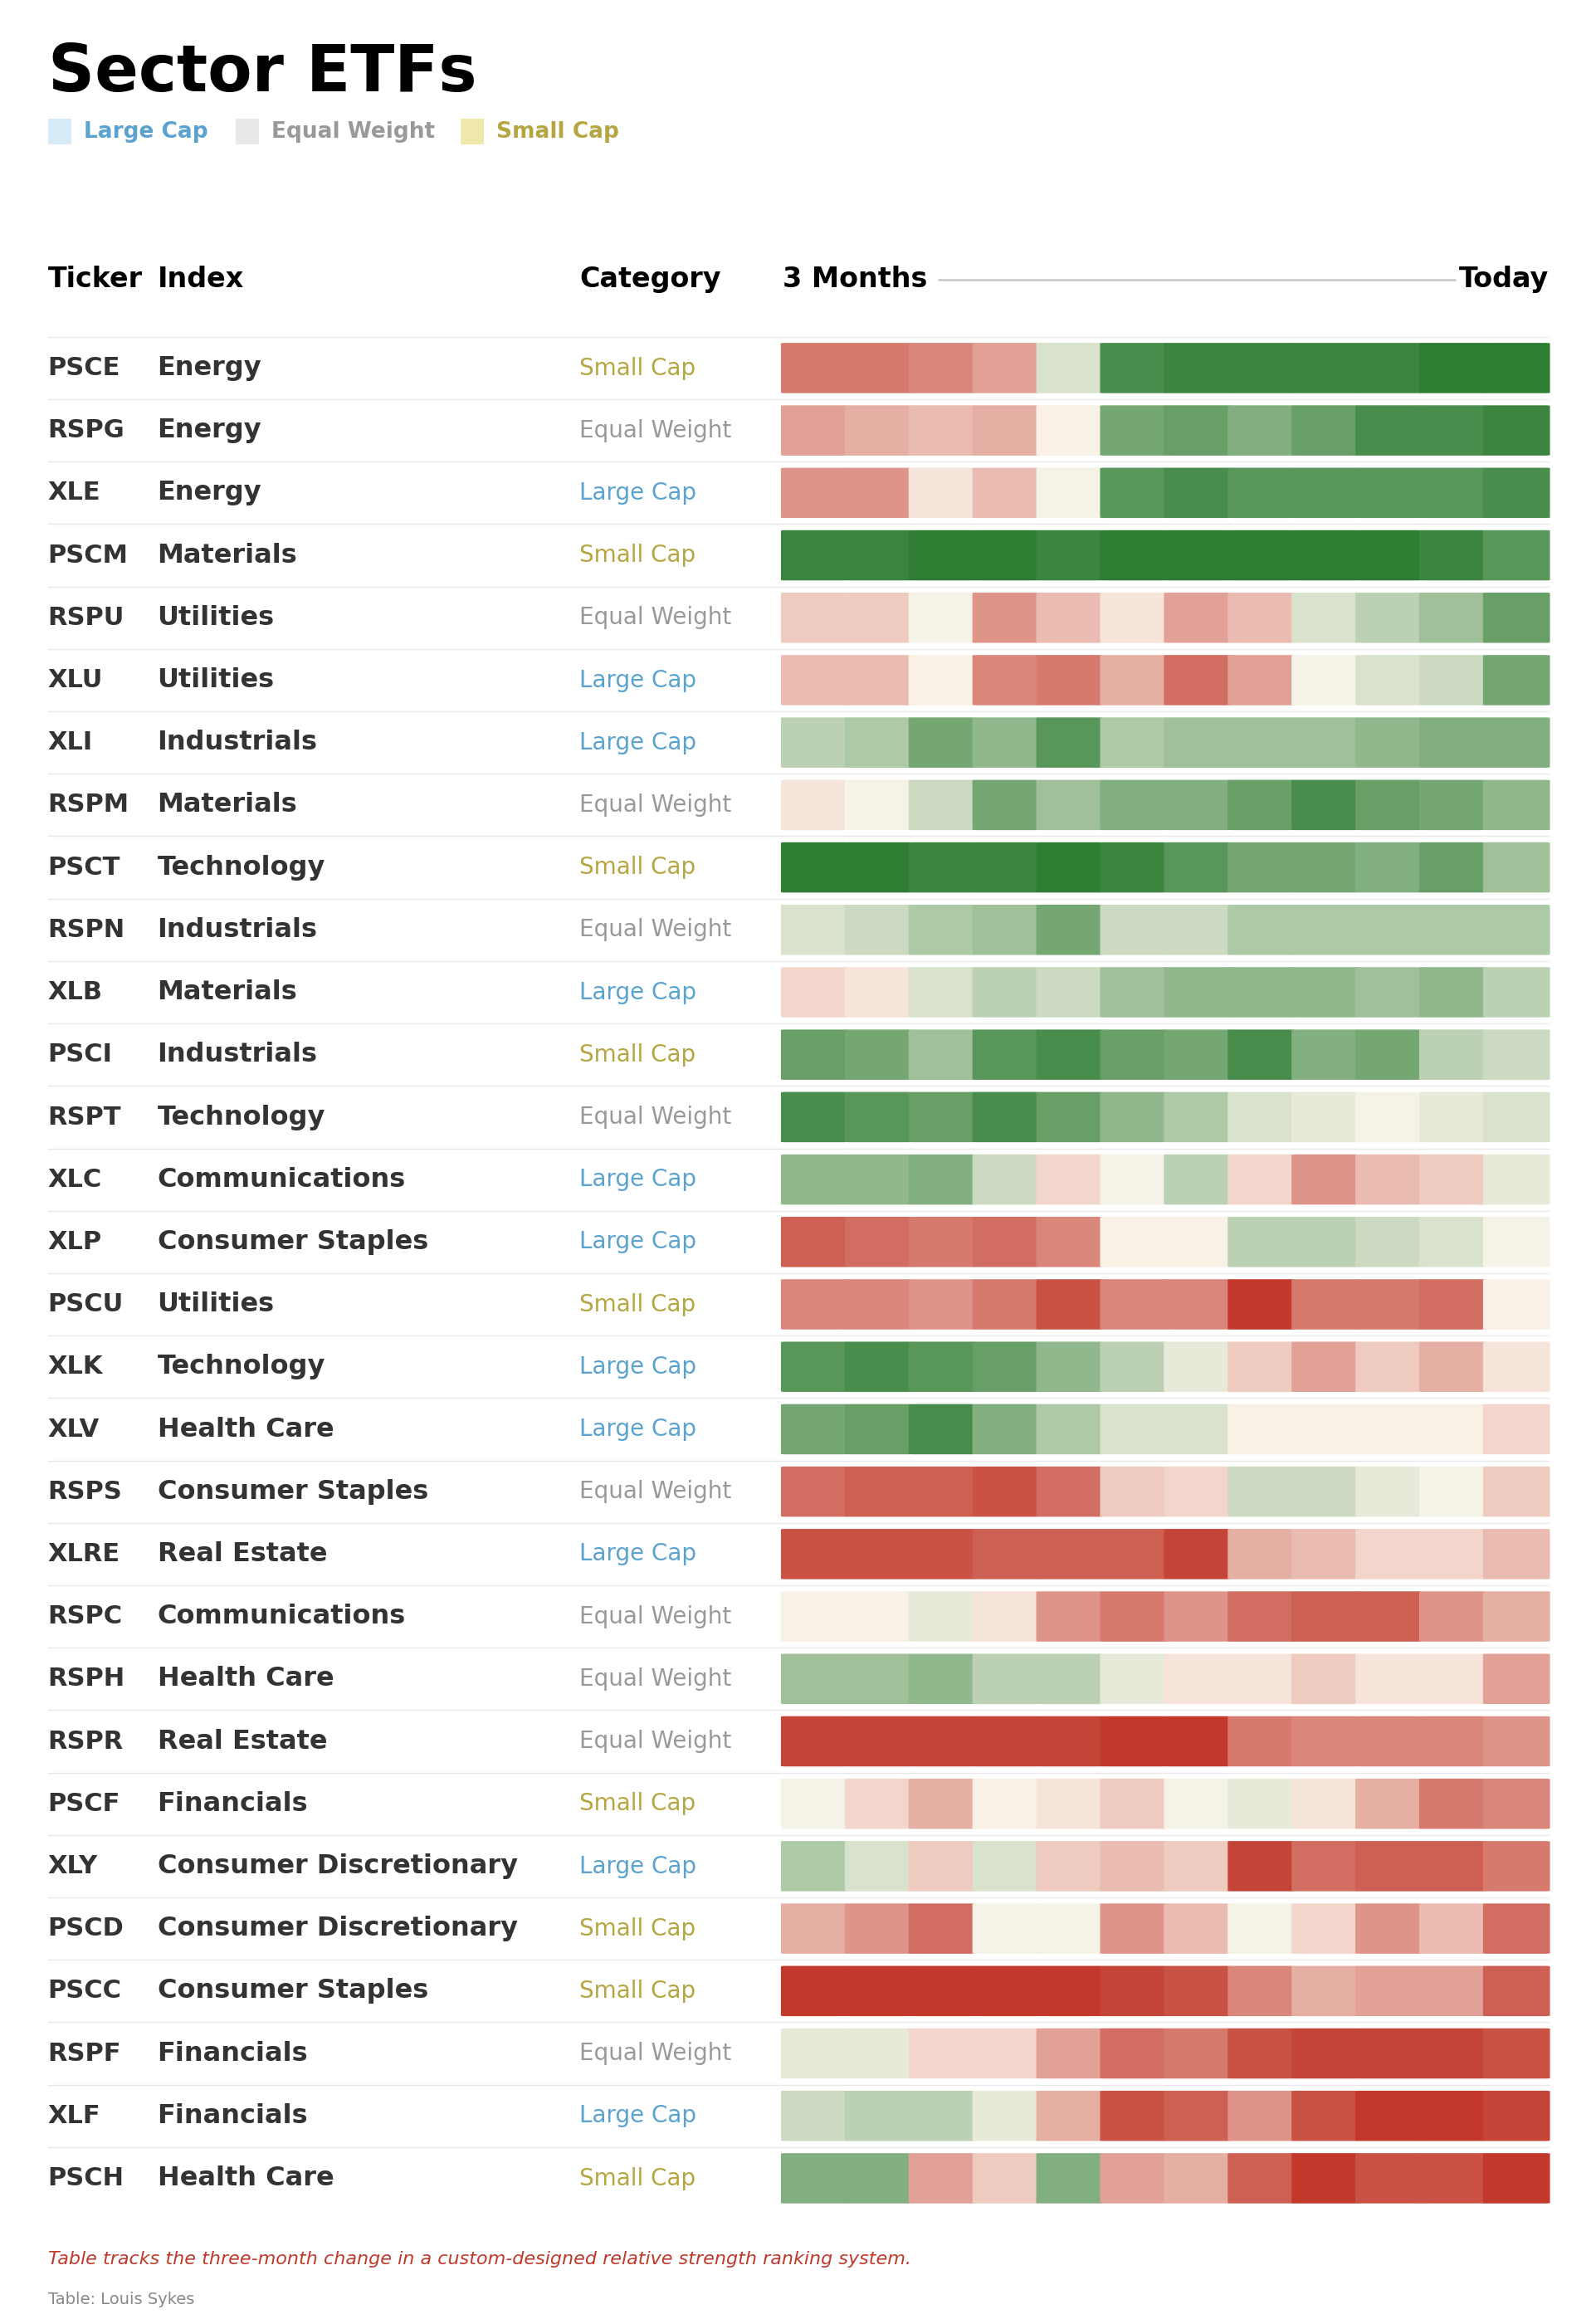
🔎 No ETF has been stronger: Energy $PSCE gained 24 spots to reach #1
🔎 Big week for Utilities $PSCU: up 10 spots to #16
🔎 The biggest loser this week is Consumer Discretionary $PSCD, shedding 6 spots to land at #26
🔎 5 straight weeks of gains for Utilities $RSPU, now at #5
🔎 Health Care $PSCH is dead last at #30 out of 30
If you're tracking these ETF rotations every week, you're already doing the hard part; watching where money is flowing. Energy ripping to #1, Health Care sitting dead last at #30. That's useful context.
But what if you could trade the individual stocks inside these ETFs on a shorter timeframe, and do it with a system that tells you exactly when to enter?
Steve Strazza, the Chief Market Strategist at All Star Charts (former SAC Capital and Point72), built two proprietary indicators around a structural change the CBOE made last year expanding expiration windows on names like Apple, Nvidia, and Amazon. Instead of one shot per week on Friday, traders can now target the exact window a move is happening and be out before volatility flips on them.
On Thursday March 12th at 4pm ET, he's pulling up the actual charts from trades that already played out, including an Exxon position that went 4x over a single weekend. Not theory. Real setups, real results.
You already own these names through your ETFs. This is about doing something with the weekly volatility they produce.