Every weekend, I review hundreds if not thousands of charts across U.S. indices, global markets, breadth, sentiment, and intermarket relationships.
And now I’m opening up my stalk list.
The names that stood out the most from my review.
This Week's Theme: Solving Problems
Last time I wrote, I described the market as "meh."
And it was.
For every chart that looked ready to break out, there was another one rolling over, failing, or chopping everyone to pieces.
But one of the most important lessons in technical analysis is that bull markets have a tendency to solve problems.
They don't solve them all at once. They don't solve them cleanly. But given enough time, strong trends tend to work through areas of weakness rather than being defined by them.
That's exactly what I'm seeing as I rip through charts this week.
Failed breakouts are finding support. Laggards are starting to participate. Bases are maturing. Relative strength is improving in places that looked broken just a few weeks ago.
Are all the problems gone? Of course not.
But compared to where we were a few weeks ago, the list of things going right is getting a lot longer than the list of things going wrong.
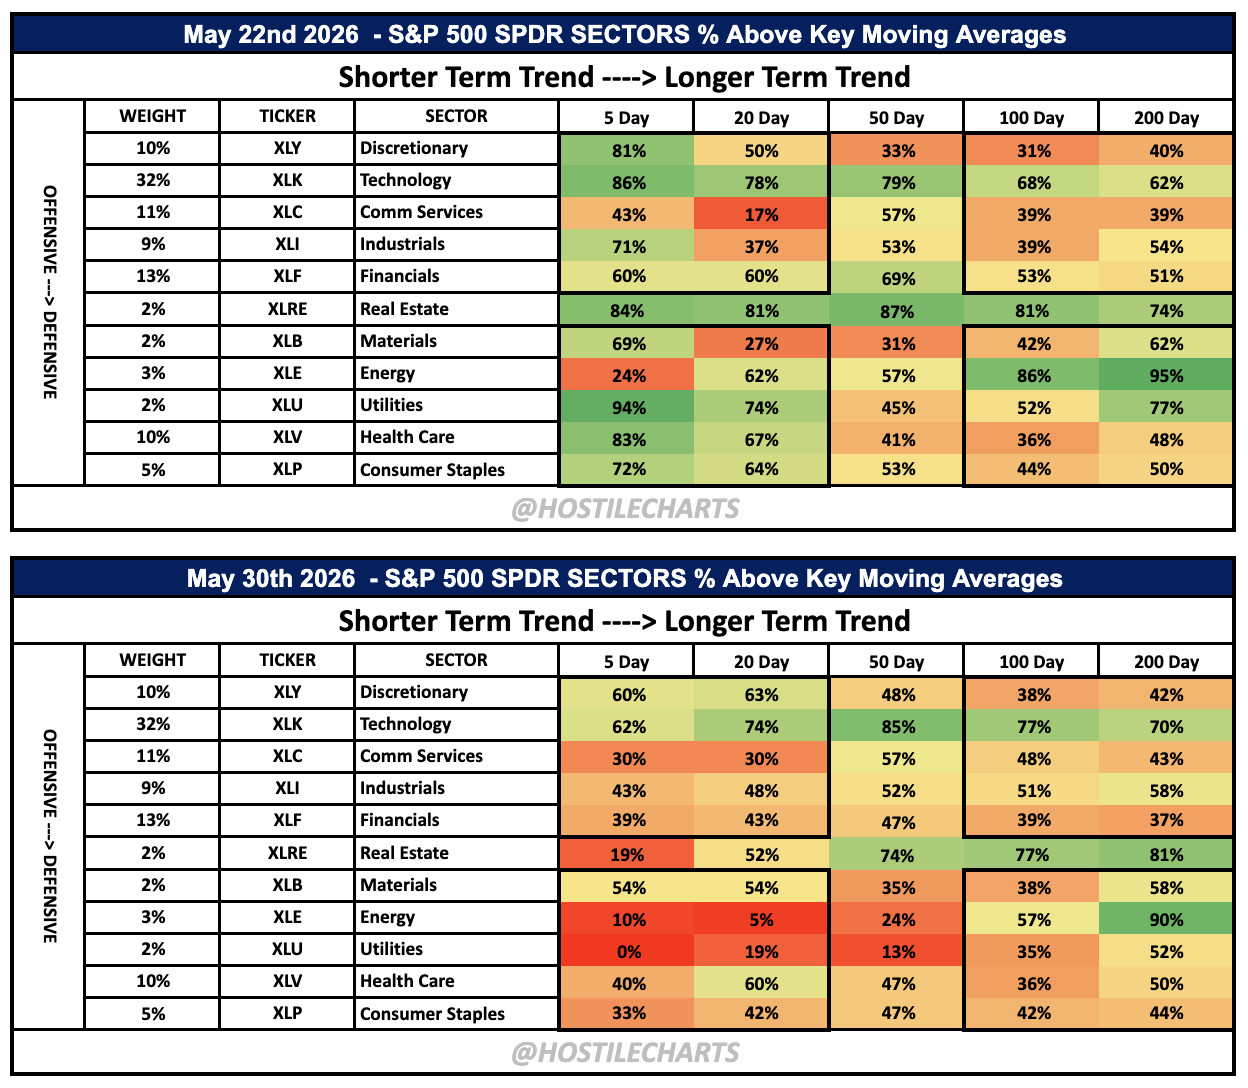
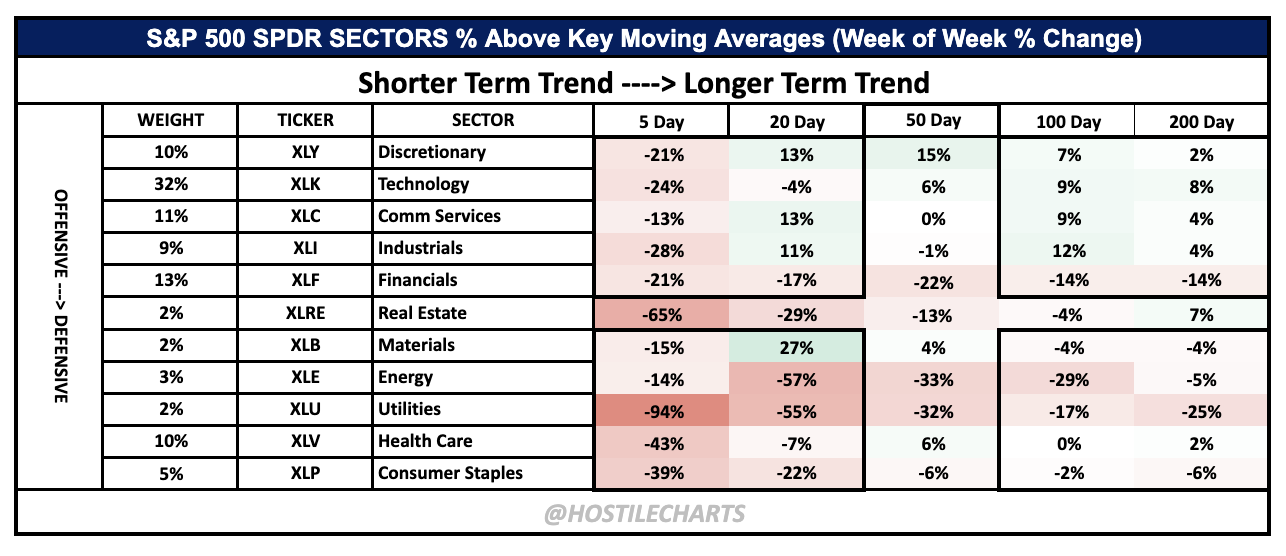
If you missed it, I broke down this dashboard and how I actually use it in my process during my weekly show.
The biggest theme this week is rotation. We're seeing money move away from defensive sectors like Utilities, Staples, Real Estate, and Energy, while participation continues to improve in key offensive groups like Technology, Industrials, and Consumer Discretionary.
Technology remains the clear leader, but what stands out most is that more sectors are starting to contribute. Bull markets solve problems through rotation, not perfection, and that's exactly what this table reflects. The areas gaining strength are the ones you'd want leading if this advance is going to continue.
The Stalk List
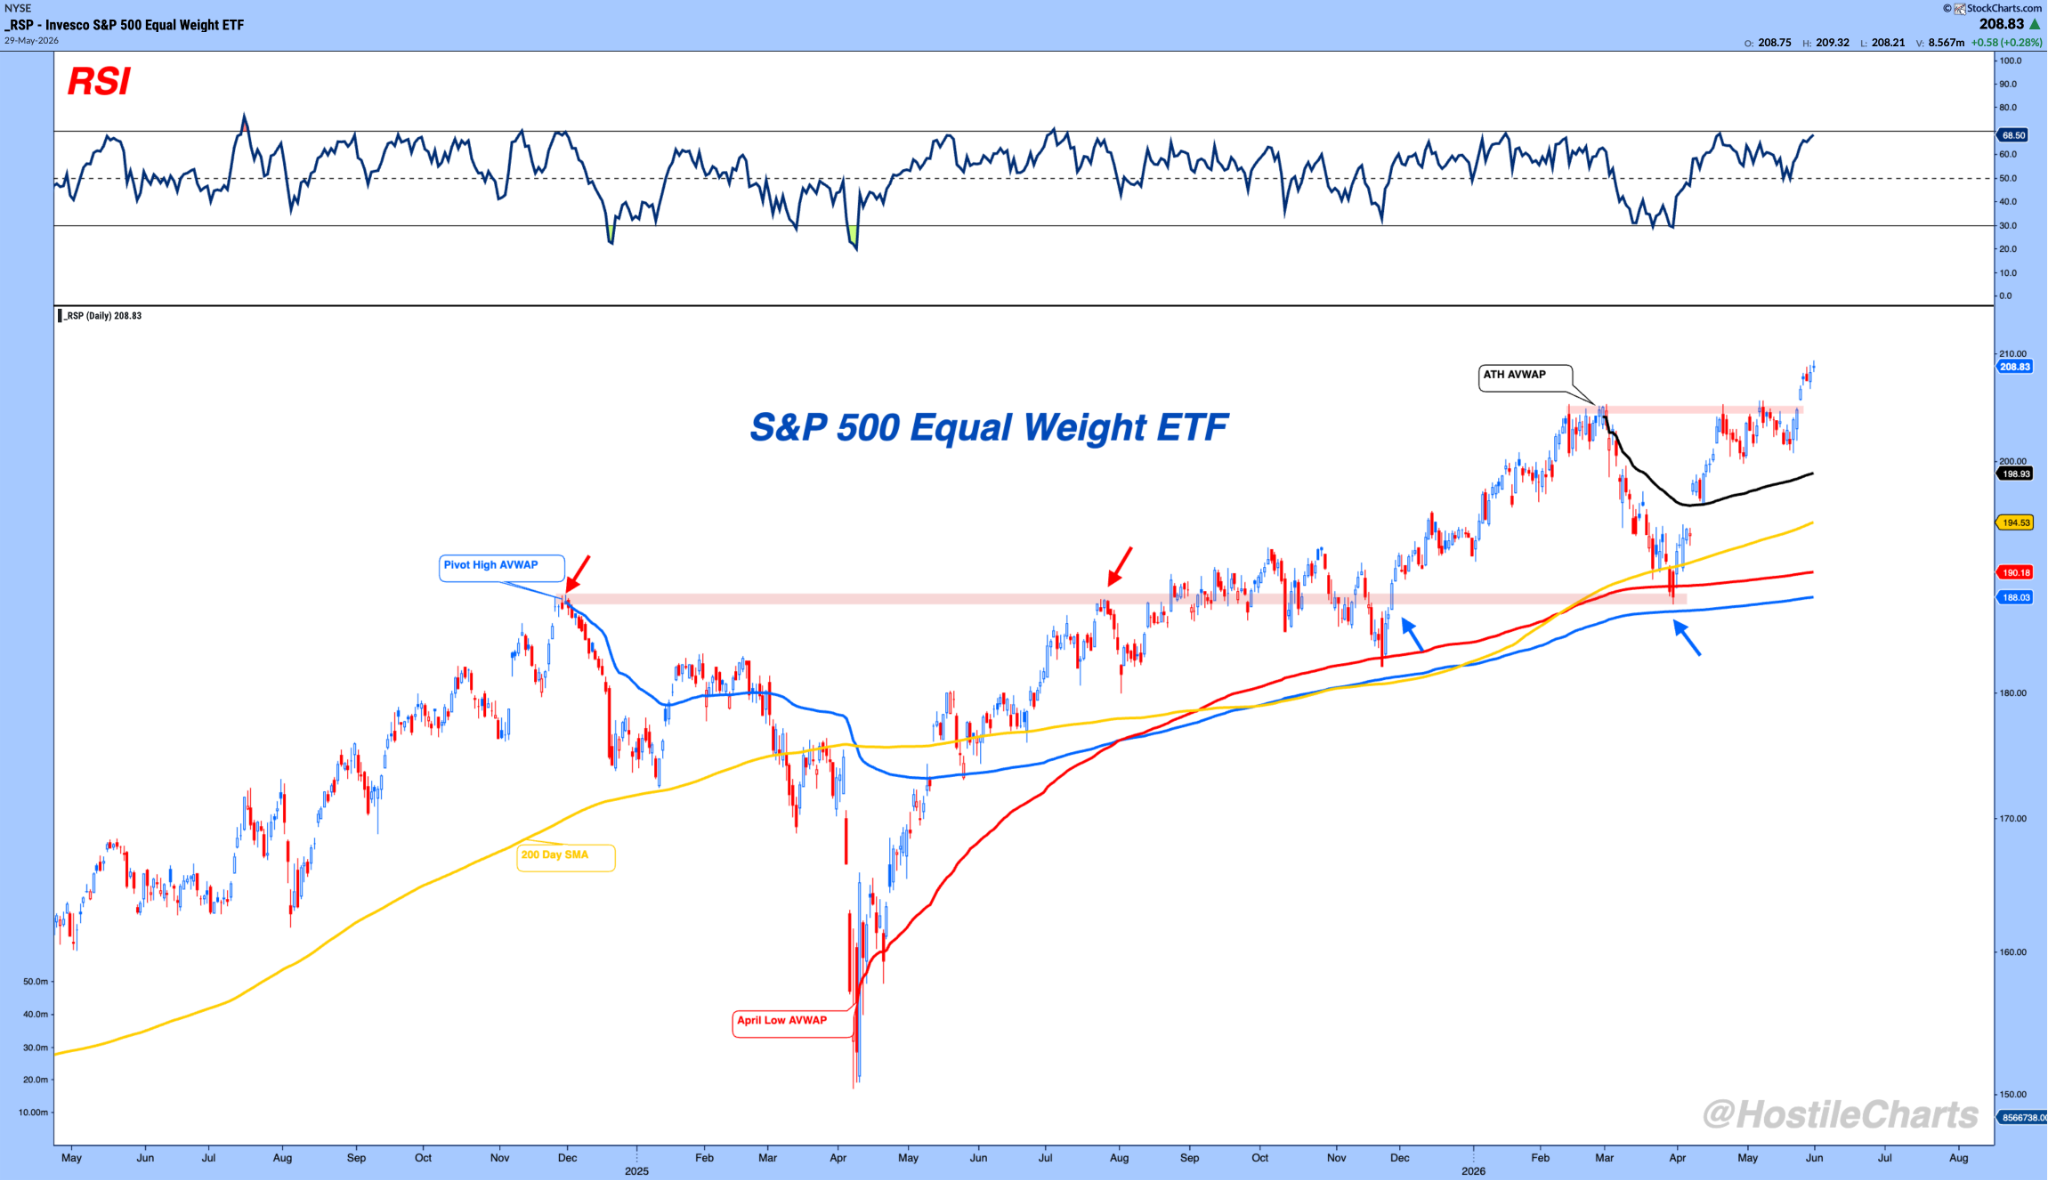
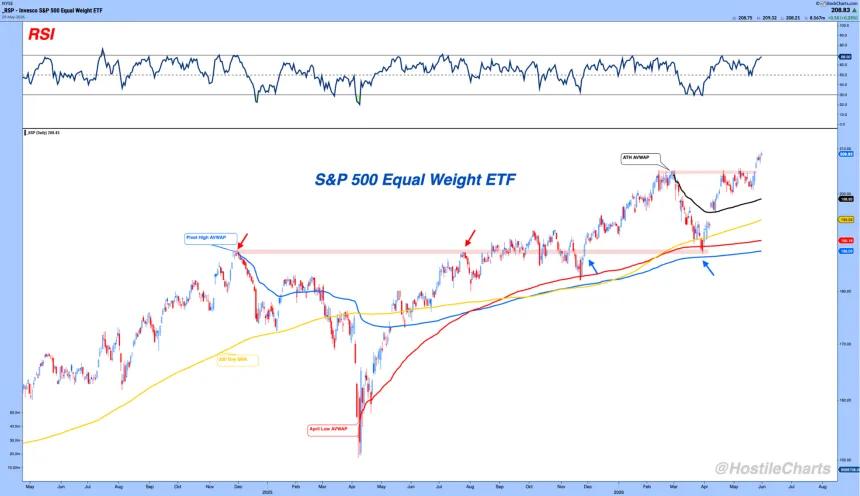
RSP - Breadth Improving
If this weeks theme is Bull Markets solving problems, this chart is Exhibit A.
RSP represents the votes from the average stock, and after spending months battling around its prior highs, it's finally clearing the all-time high AVWAP and pushing into new highs.
That's exactly what you want to see if this rally is going to broaden beyond just the mega-cap names.
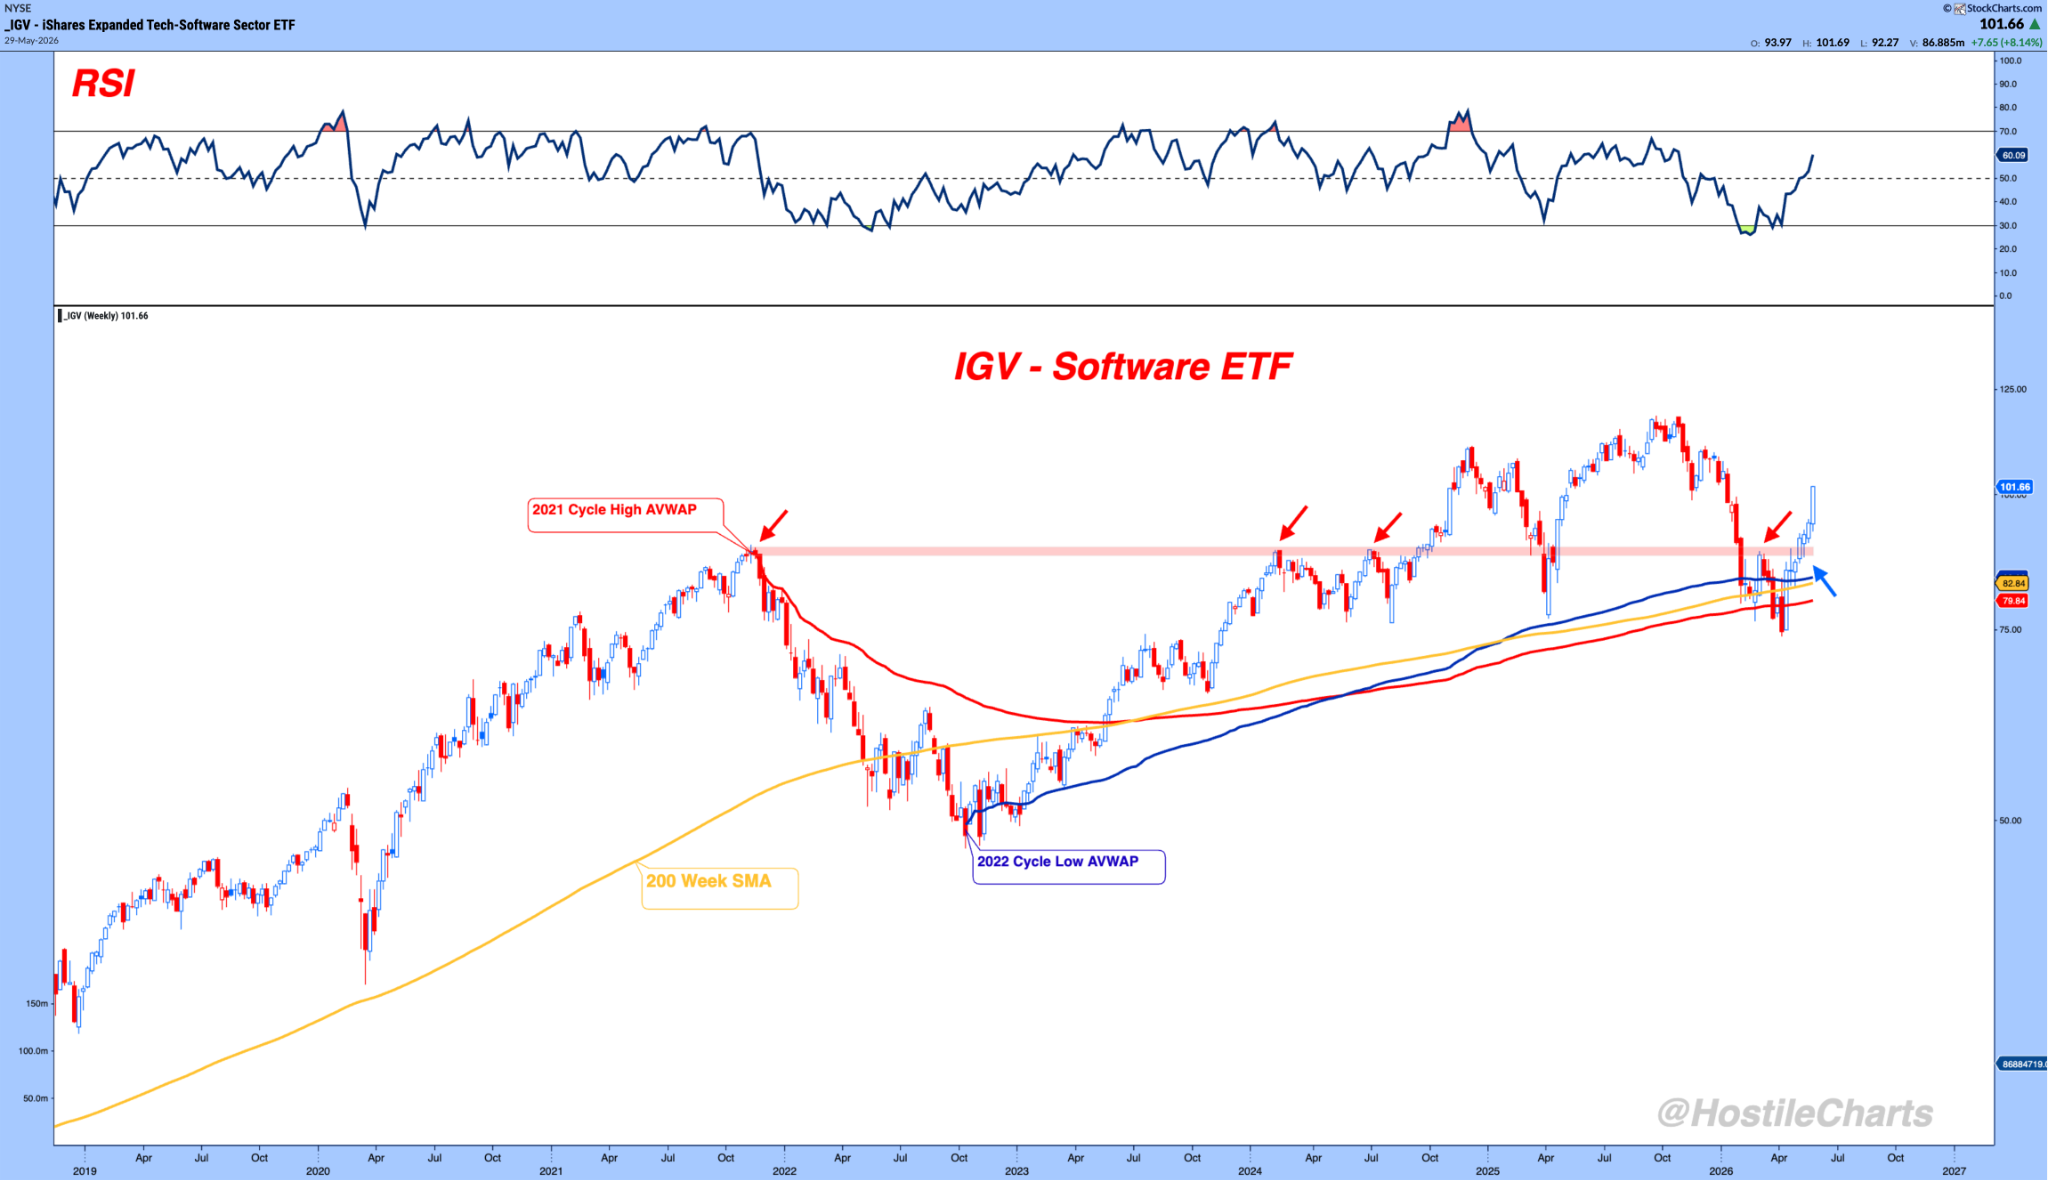
IGV — Software Recovery
One of the biggest problems the market has been working through is the fear that AI would destroy software margins and commoditize the industry.
This chart suggests that concern may be fading.
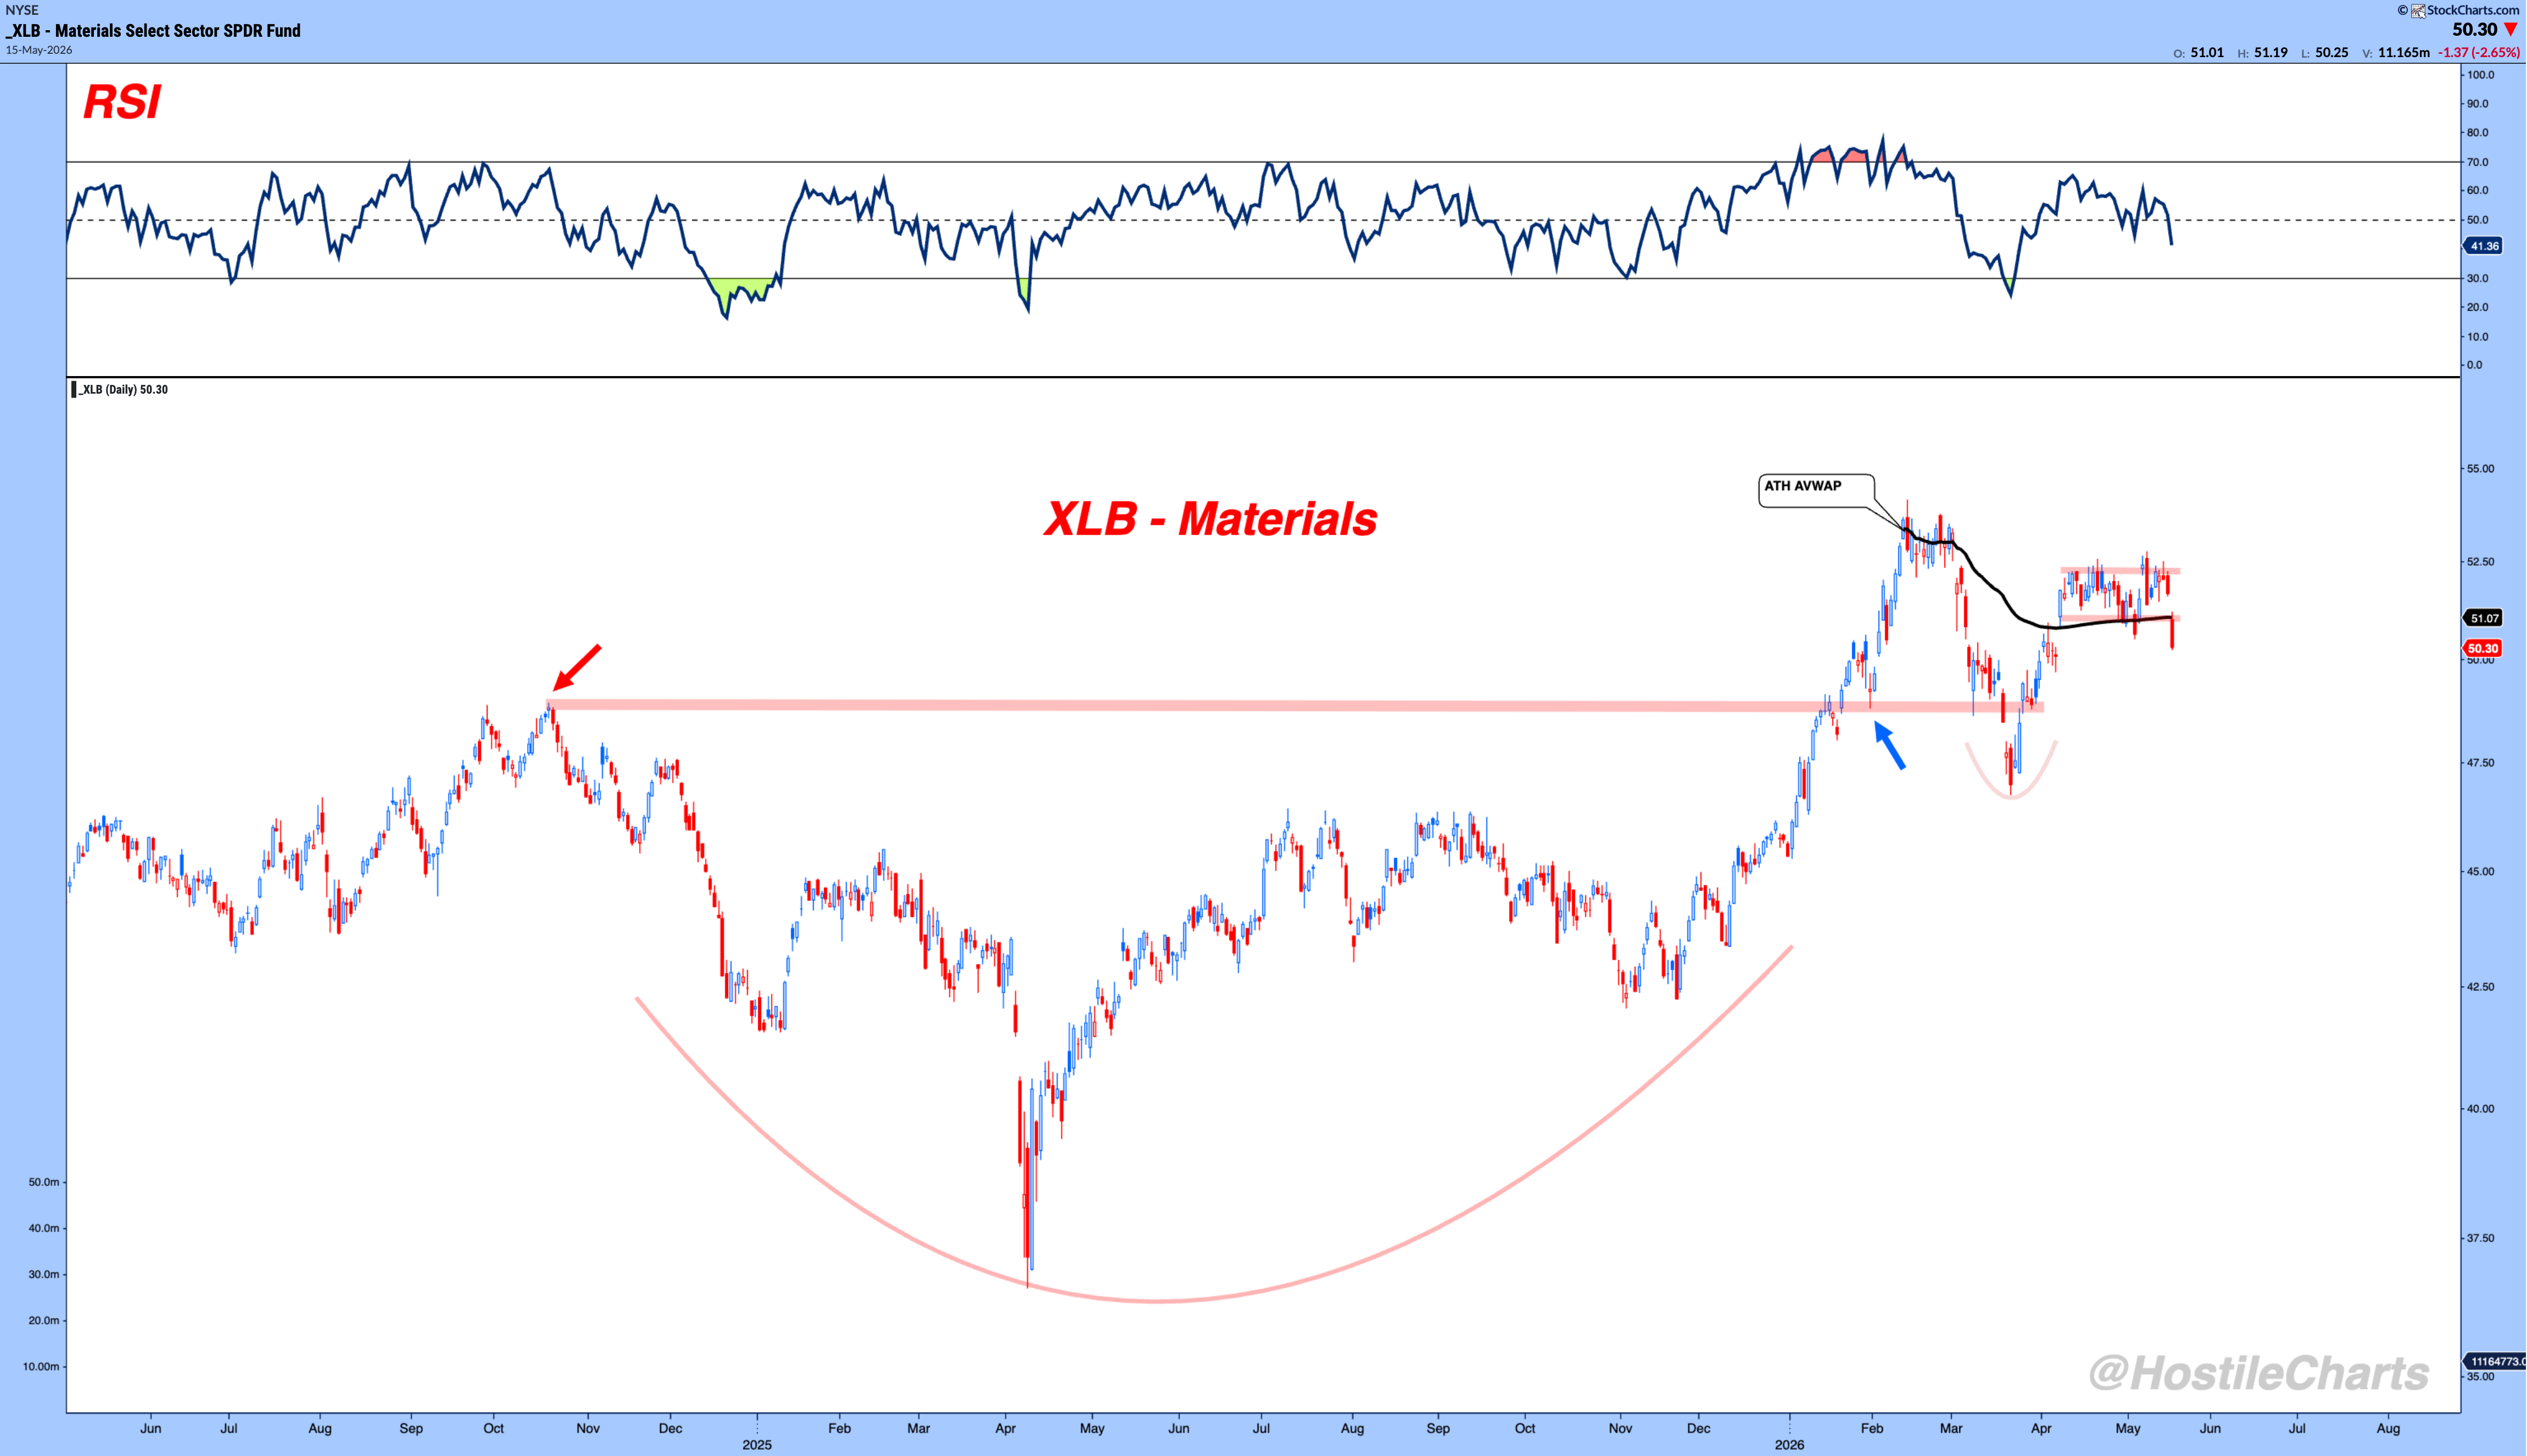
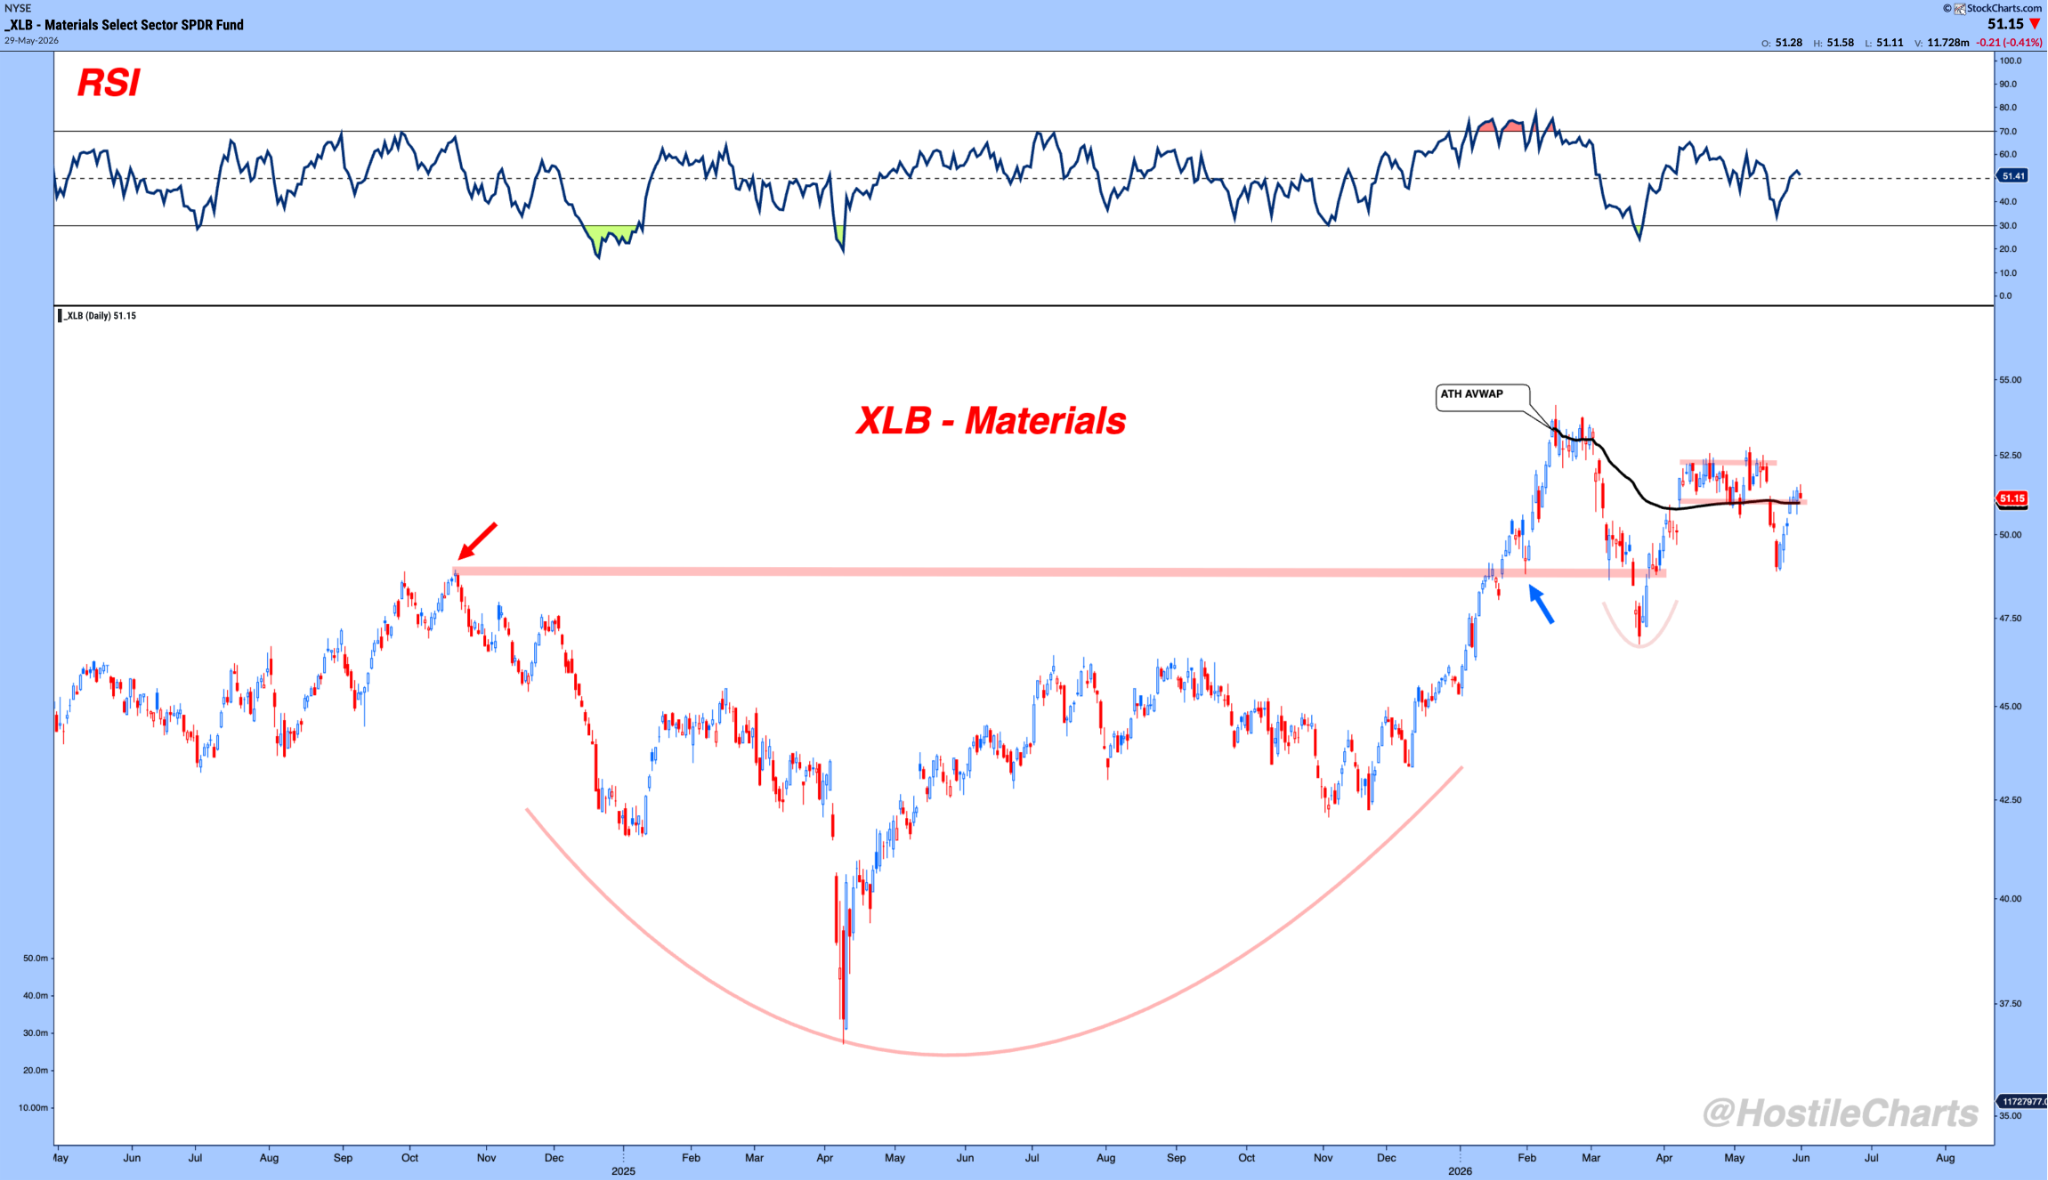
XLB — Materials - Failed Breakdown
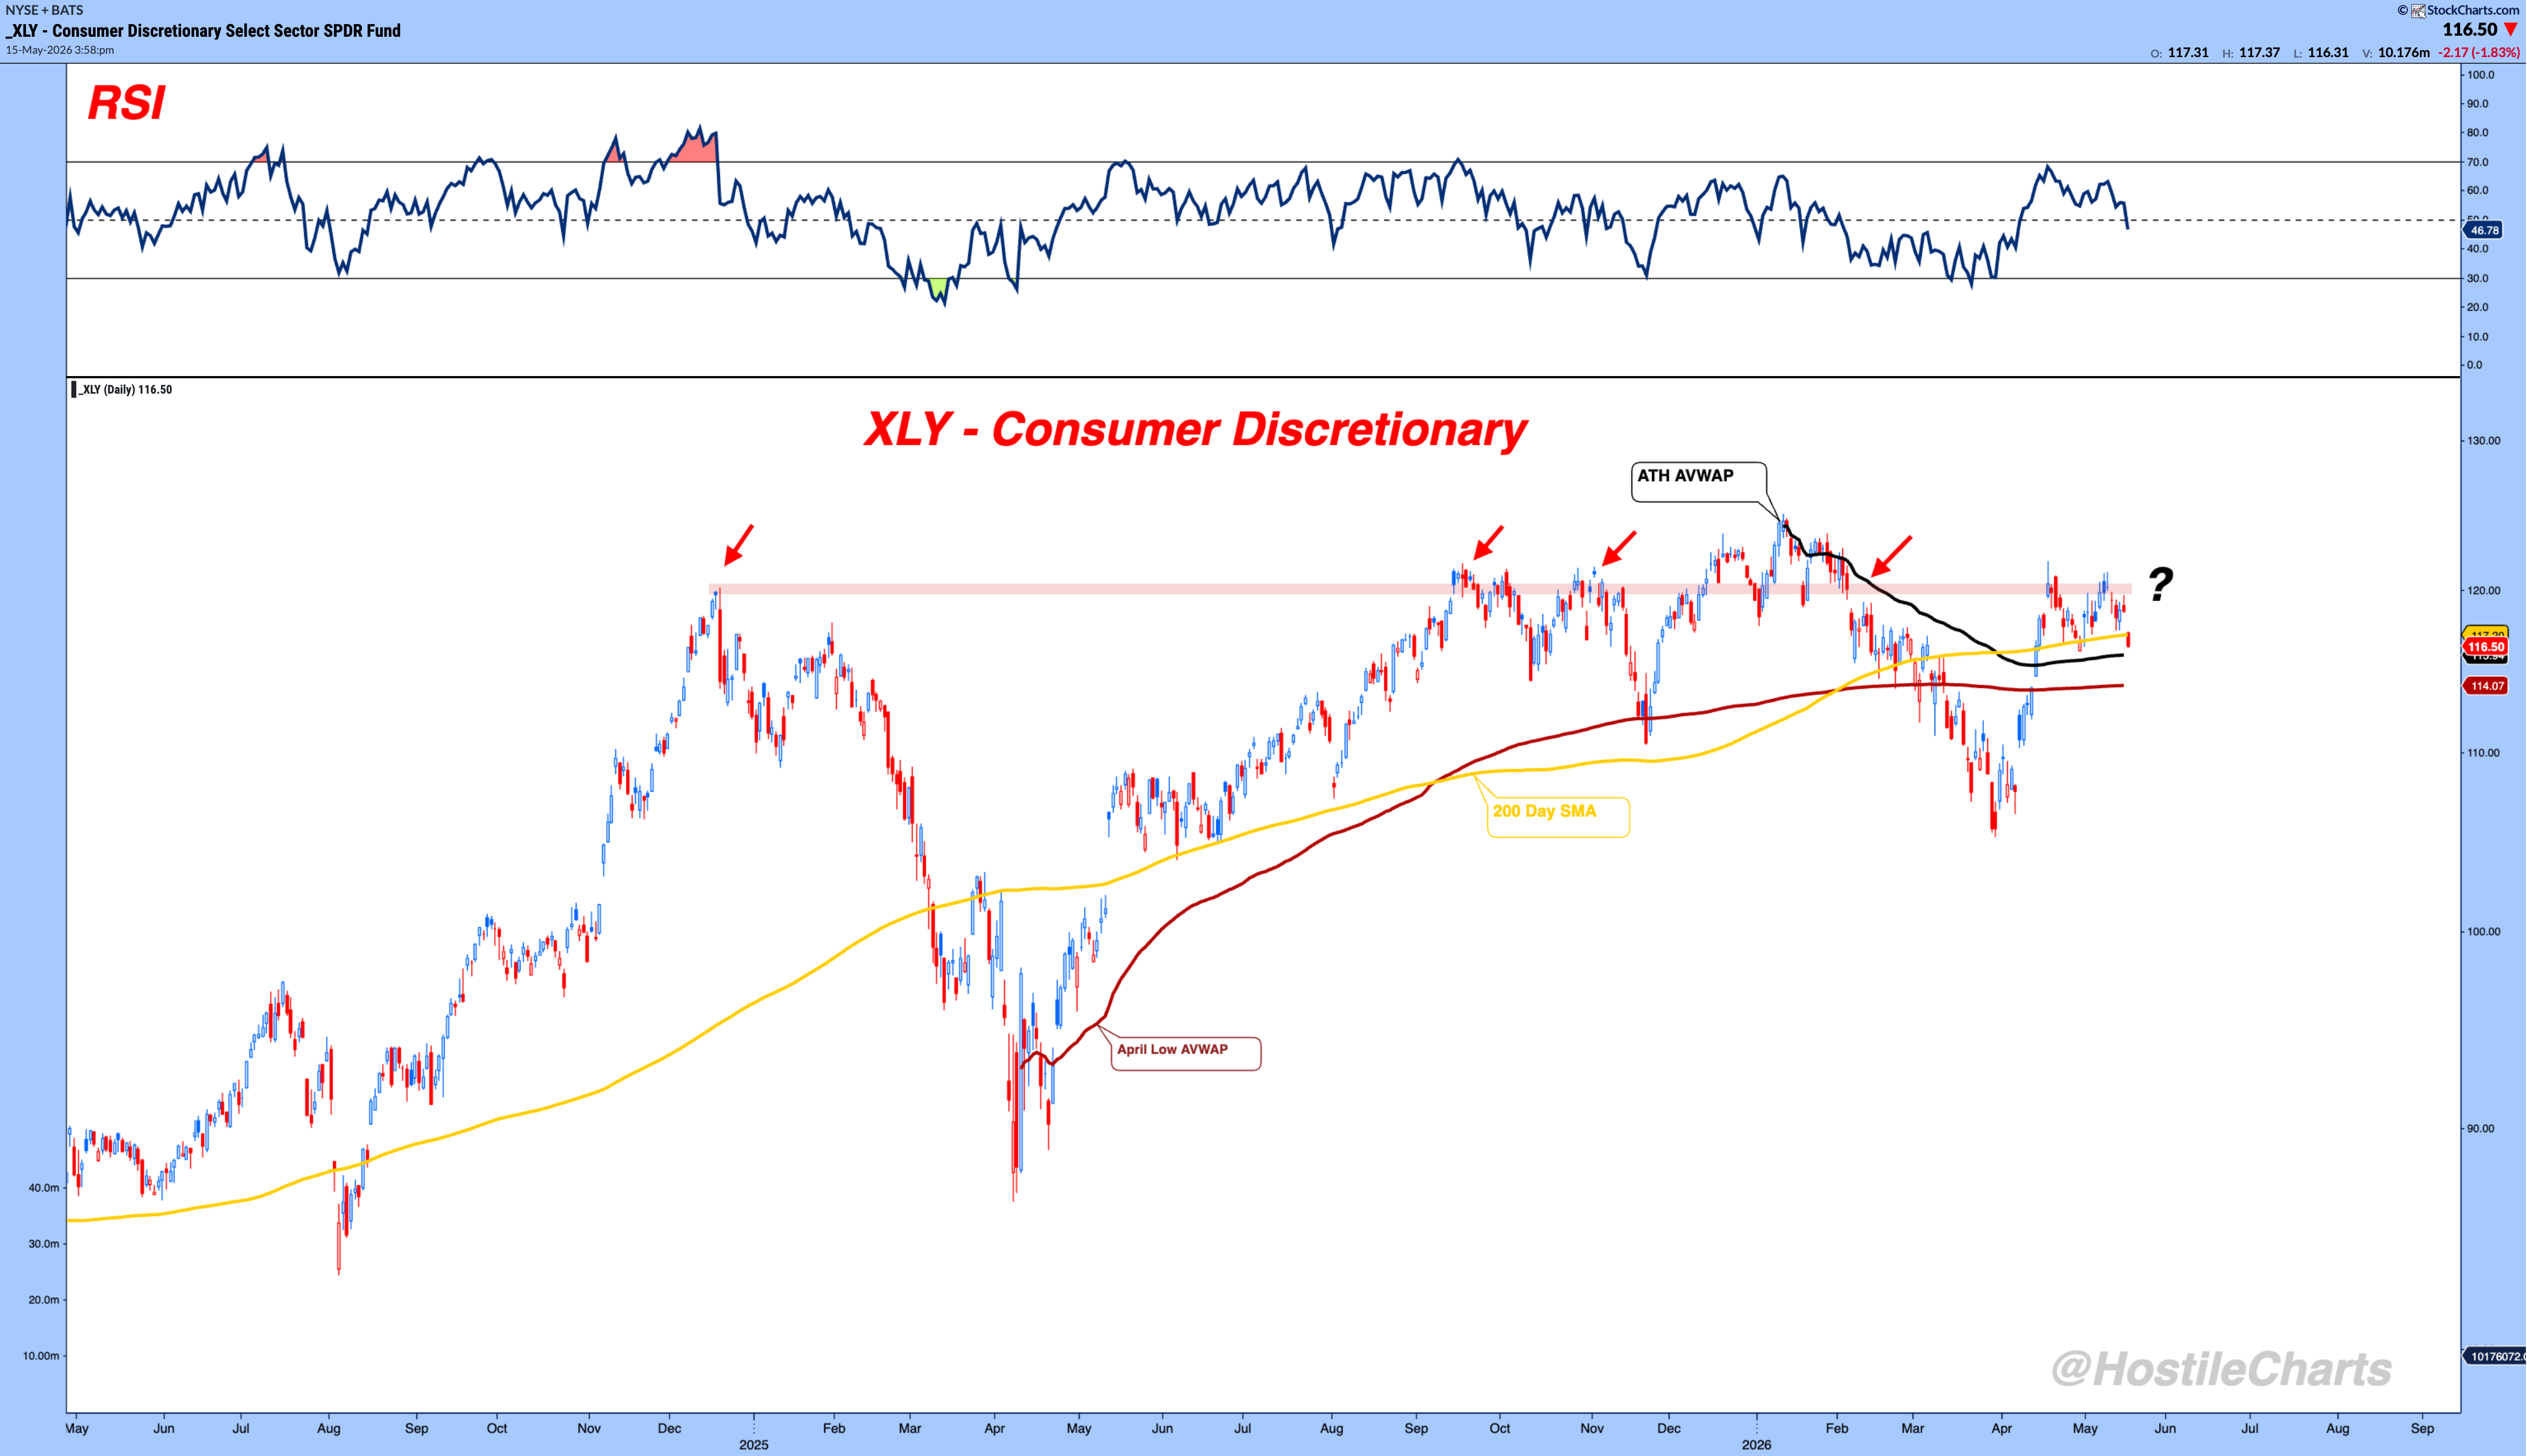
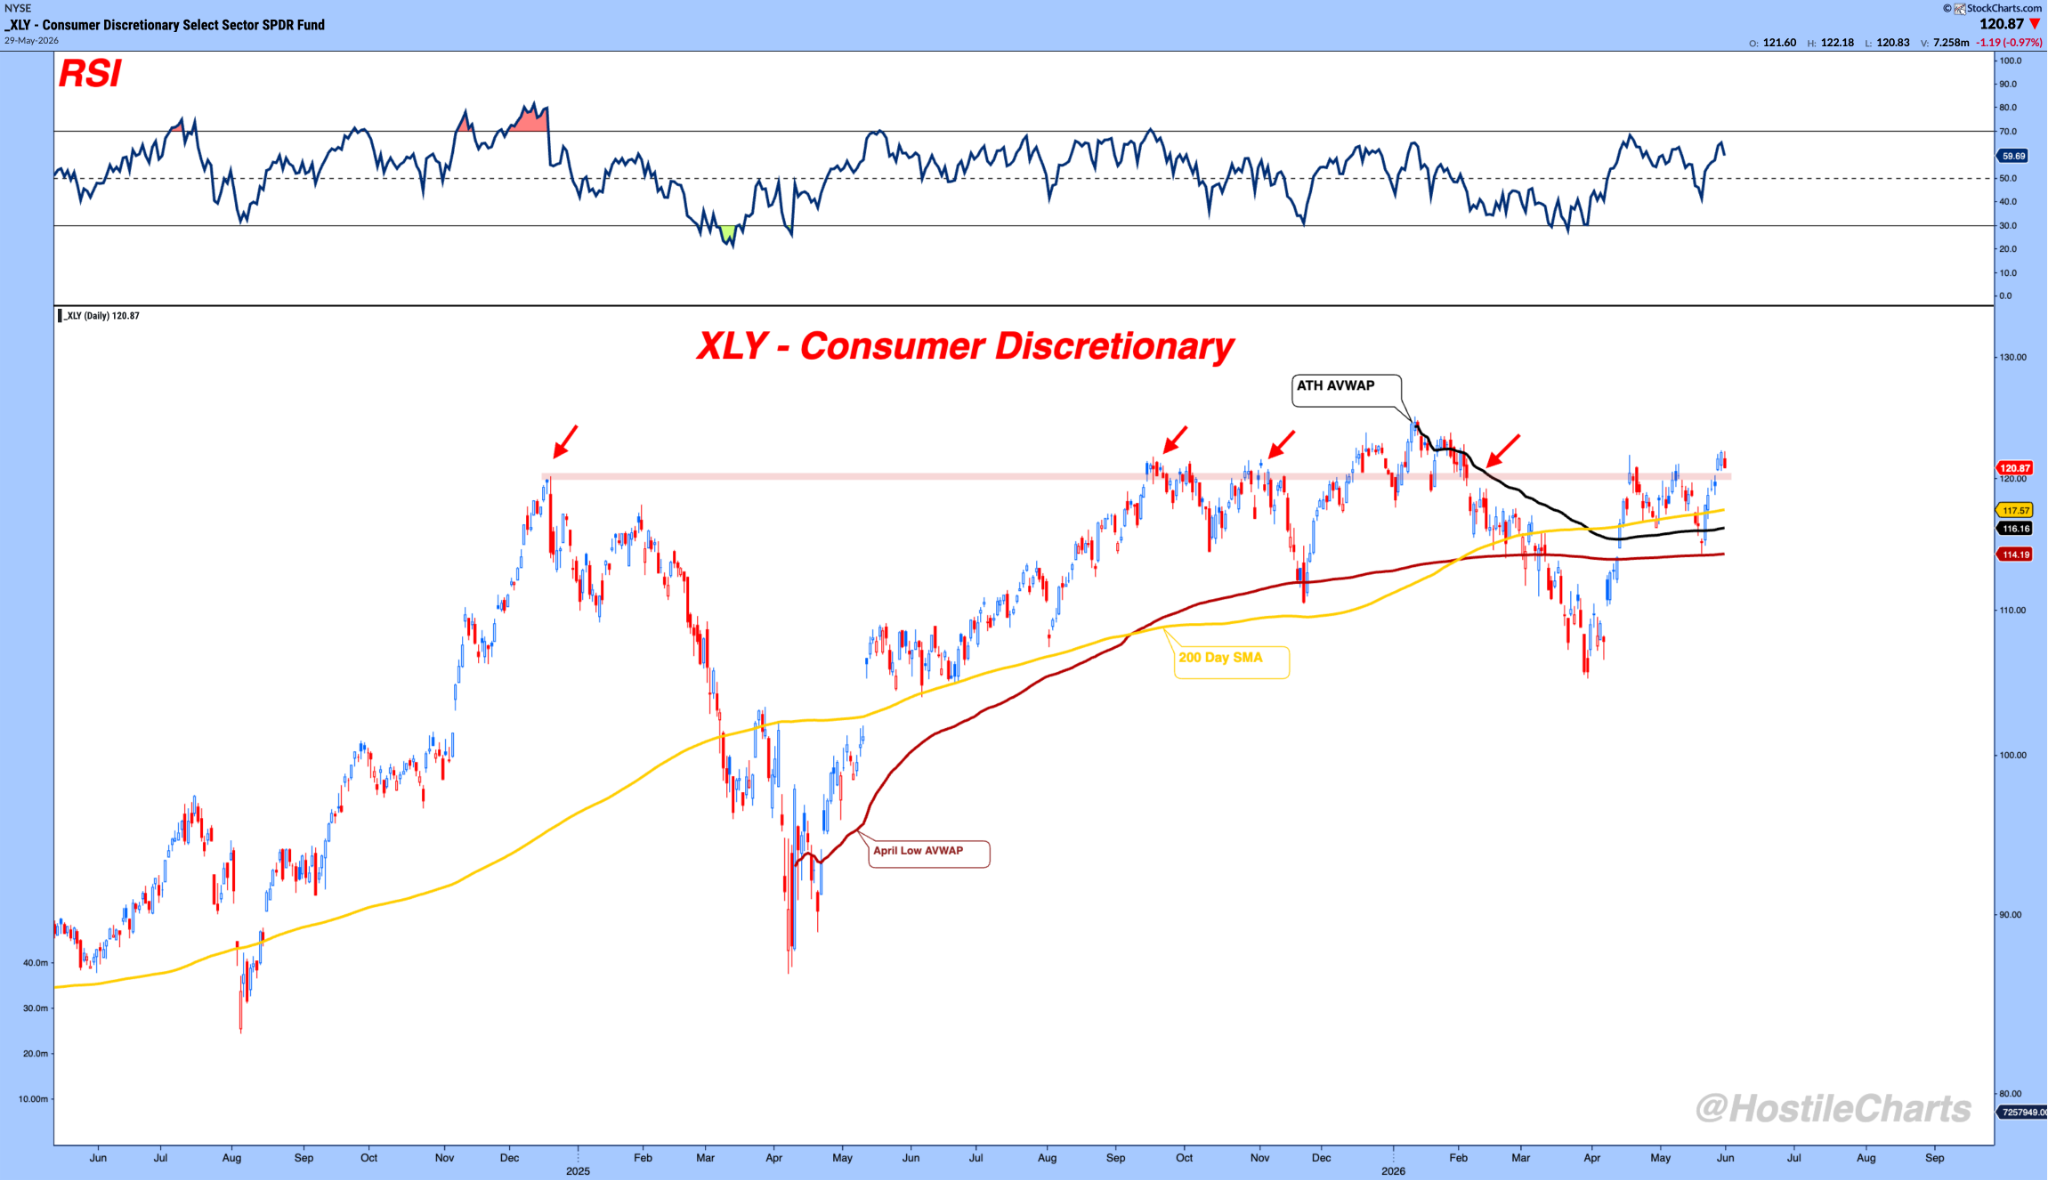
XLY — Consumer Discretionary - Failed Breakdown
My Two Cents
Bull markets have a funny habit of frustrating both the bears and the impatient bulls by simply taking time to work things out.
No market is perfect. No chart is perfect. But when I look across the board this week, I see a market doing what healthy Bull Markets do best.