the daily number logo, light mode
grant hawkridge daily number

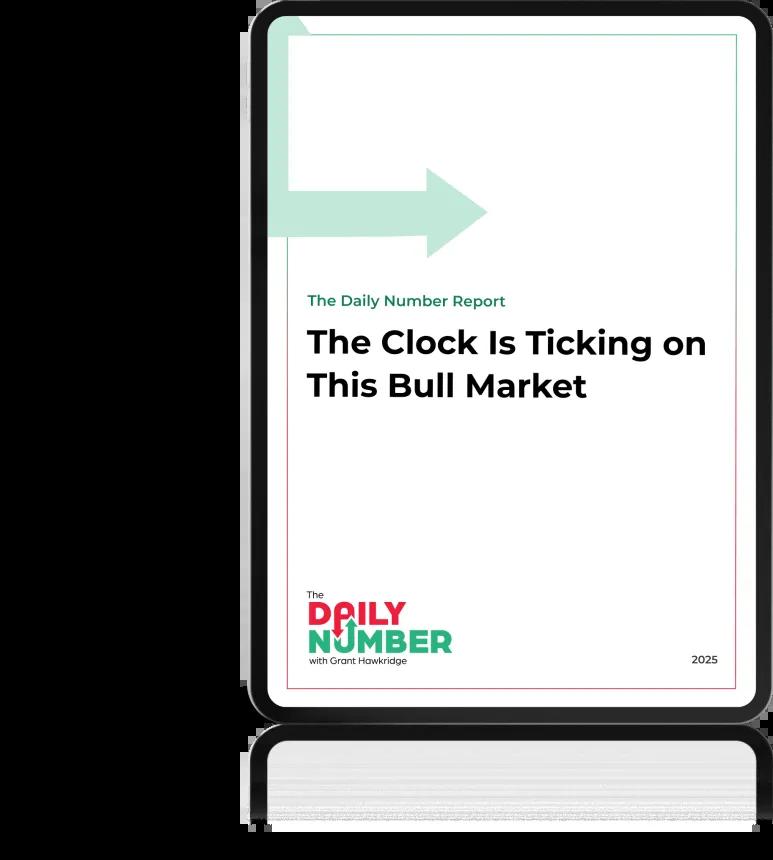
The Clock Is Ticking On This Bull Market
What Happens When Breadth Fades and Cycles Collide.


Two powerful market cycles are converging — and history says that overlap doesn’t go unnoticed.
See what the data reveals about 2026 before the next reset begins.

Enter Your Email Address For Instant Access to the Report.

Daily Number Report

The strongest internal market in decades may be running out of time.

This special Daily Number anniversary report reveals what the data says about 2026 — and why two powerful market clocks are about to strike at once.

Inside, you’ll see how the 20-Day Breadth Thrust and the 4-Year Presidential Cycle are aligning — a rare overlap that’s only appeared a handful of times in history. Each time, it marked a turning point that few were prepared for.

You’ll also discover what the January Trifecta could signal next.

These early-year indicators have a long record of revealing whether strength will extend… or fade.

 This Report Breaks It All Down:

The charts that map every Breadth Thrust since 2003.

The historical context that explains how strong markets shift before they reset.

Forward-return tables that show what typically follows.

If you’ve followed The Daily Number, you already know the process:

No noise. No opinions. Just data that tells the truth — before the crowd catches on.

Get the free report and see what the next phase of this bull market really looks like before time runs out.

laptop screen showing stock market sceen