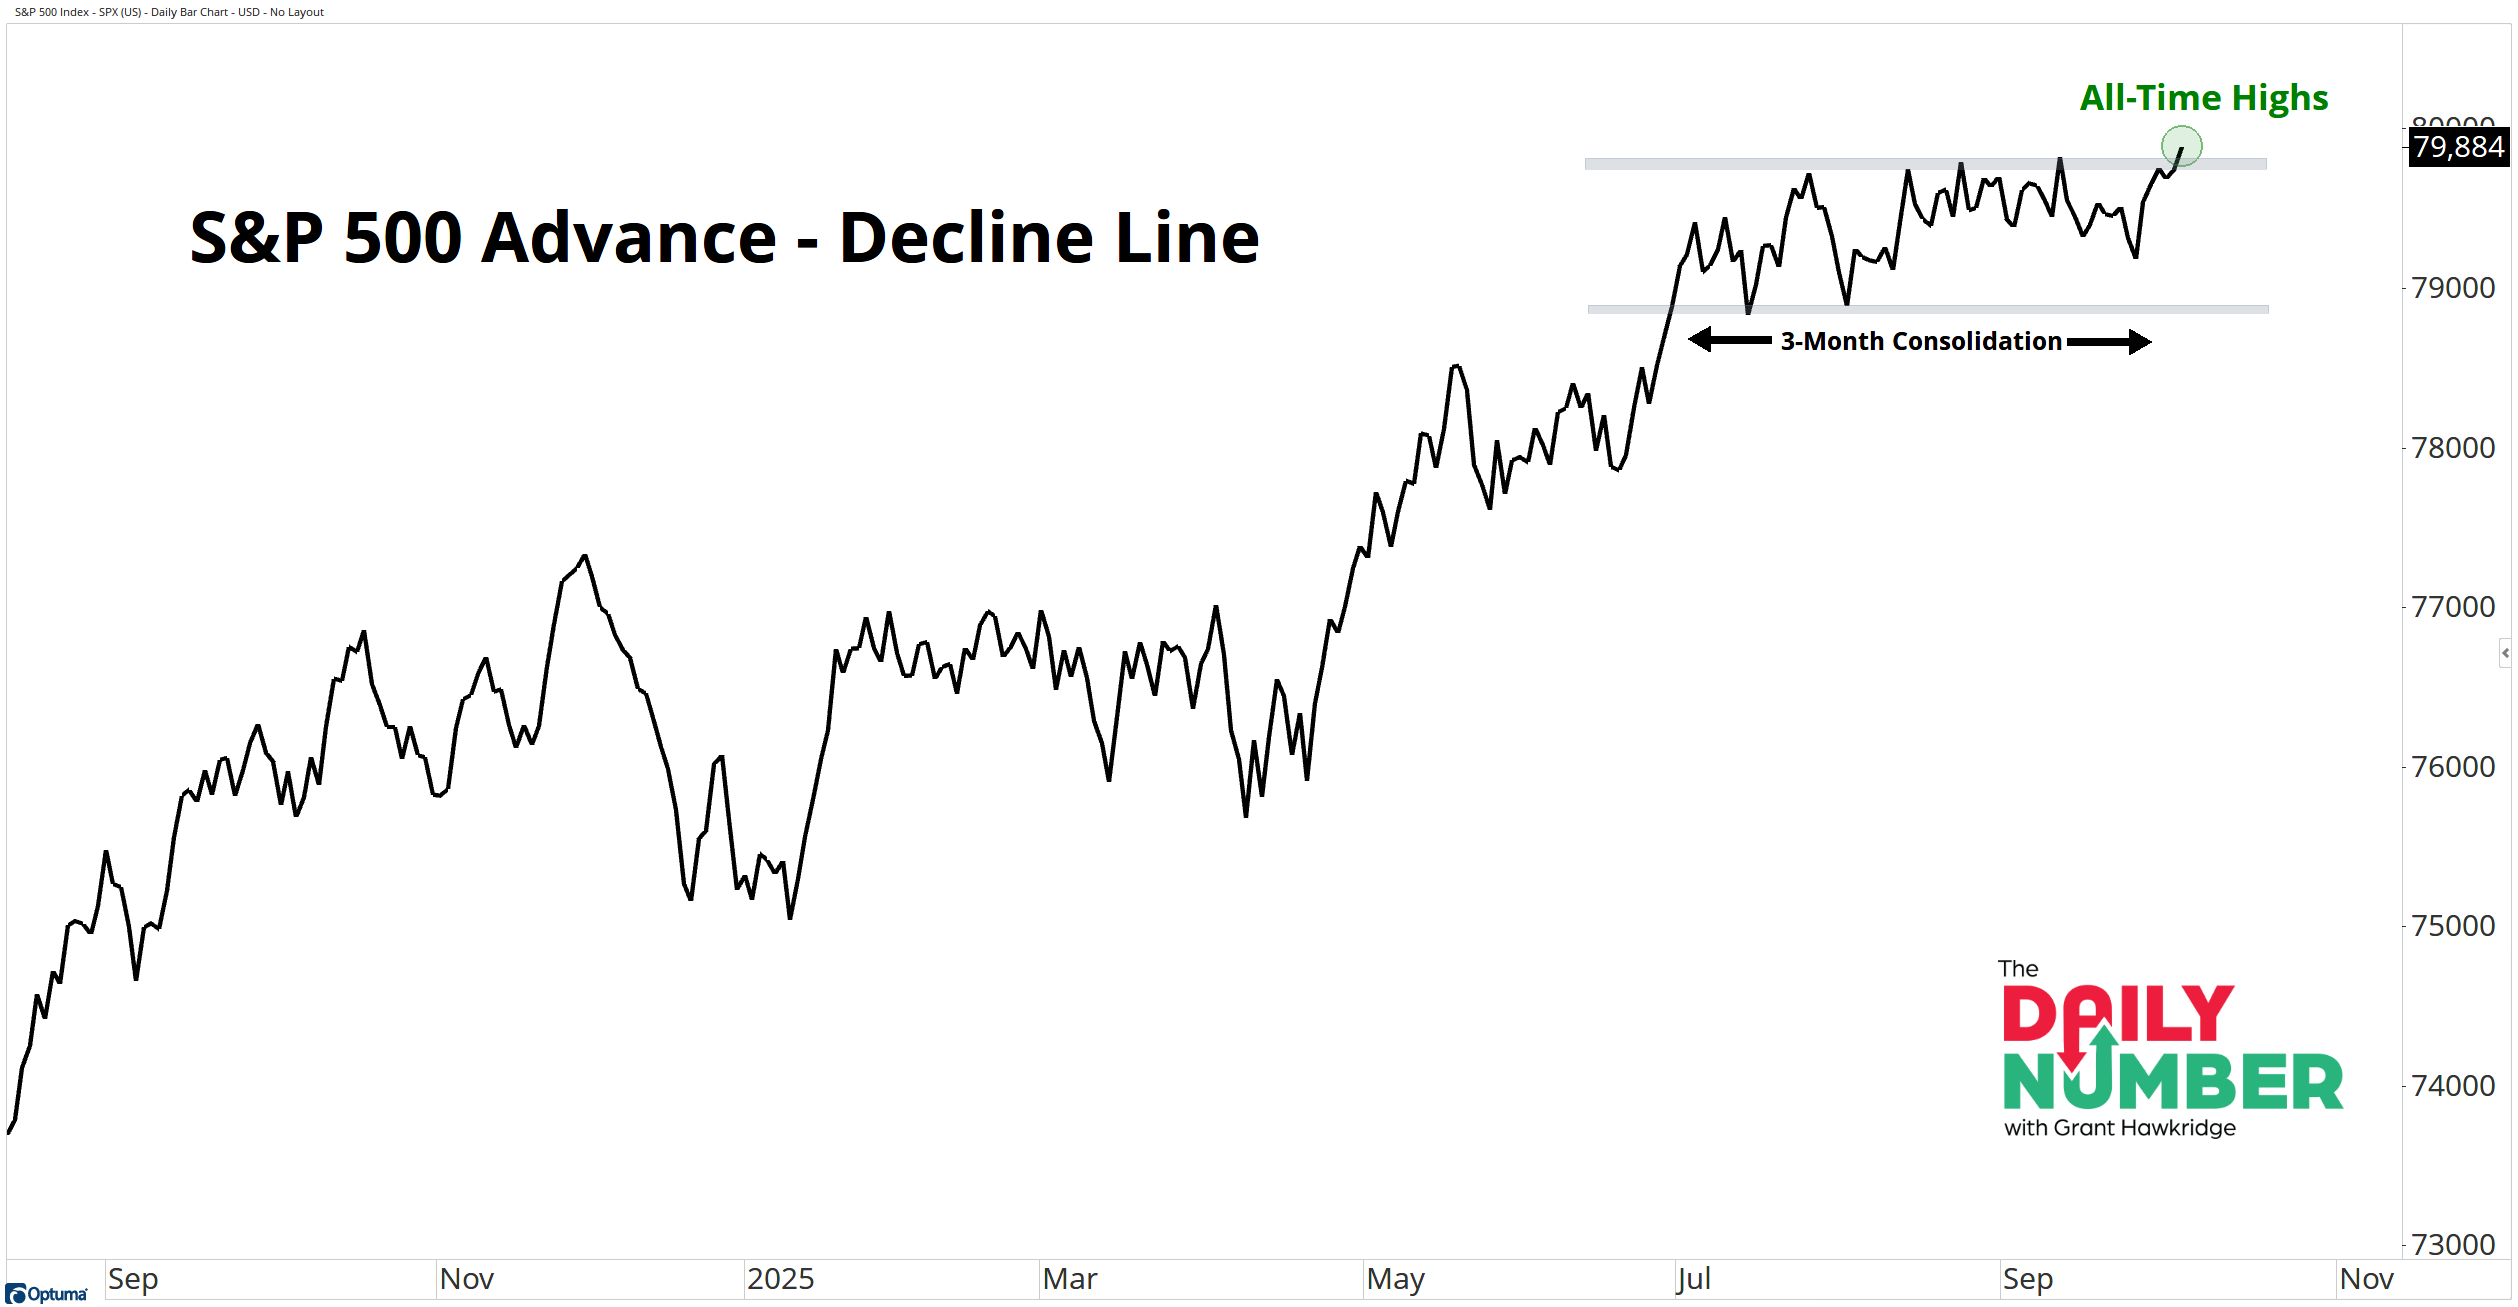
That’s how many months the S&P 500 Advance–Decline Line spent consolidating before breaking out to fresh all-time highs last week.
Here’s the chart:
Let's break down what the chart shows:
The black line tracks the cumulative S&P 500 Advance–Decline Line, the total number of advancing stocks minus those declining each day.
The Takeaway: From July through September, the A/D line moved sideways, forming a three-month base while the index kept making new highs. The A/D Line has now pushed decisively above that range, confirming a new high in participation.
Breadth is expanding again, and the market’s internal engine is firing on all cylinders.
When the A/D Line hits new highs alongside price, it tells us strength is broad, not concentrated.
After three months of resetting its internal strength, the market is breaking out again.
The consolidation did its job. Strength is spreading beyond the usual leaders.
That’s not speculation, it’s the tape speaking loud and clear.
If breadth is breaking out again, what’s left for the bears to argue?
If you find my content valuable, I would greatly appreciate it if you could share it with your friends, family, and colleagues. Your help in spreading the word is invaluable in supporting our work. Thank you to all of you who share!