The Risk-On Index just reached a 4-year high. The last time it was this elevated was June 2021.
Here’s the chart:
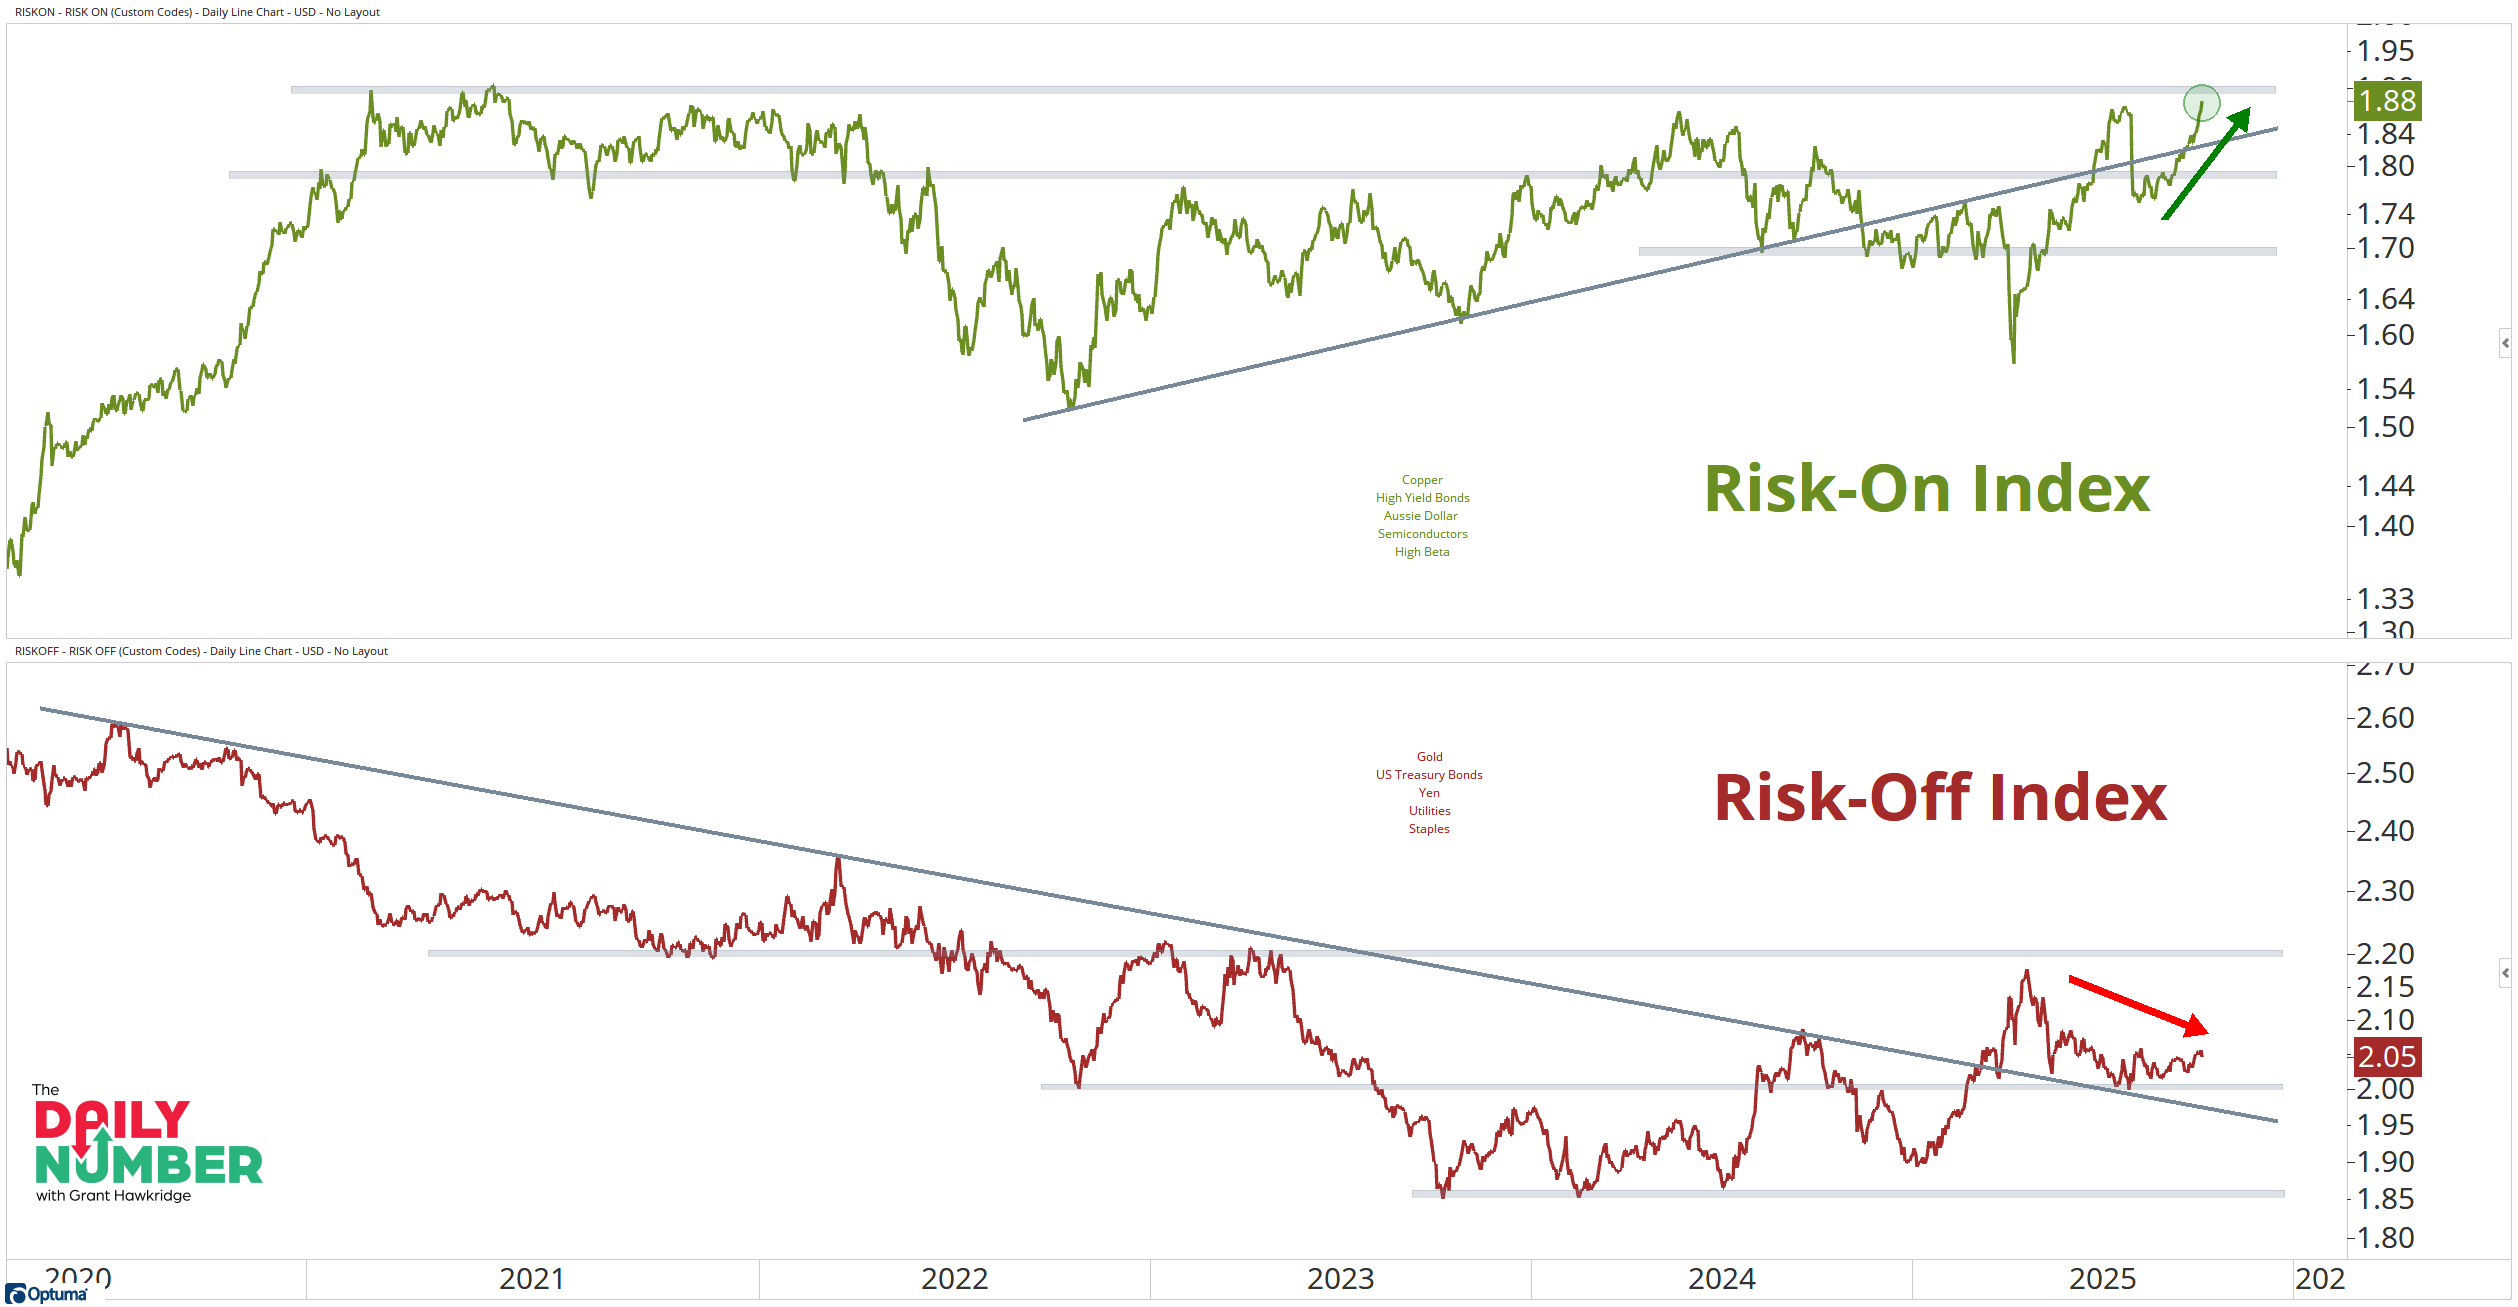
Let's break down what the chart shows:
The top panel shows the Risk-On Index in green. It includes copper, high-yield bonds, semiconductors, the Australian dollar, and high-beta stocks.
The bottom panel shows the Risk-Off Index in red. It includes gold, Treasuries, the yen, utilities, and consumer staples.
The Takeaway: This is the highest Risk-On reading in more than four years.
The breakout is not happening in isolation. Semiconductors are leading. High-yield bonds are pushing higher. Copper is trending. High beta is outperforming.
Every component of this custom index is contributing. Risk appetite has been building since April. This move to 4-year highs confirms it.
When offensive parts of the market rally together, it speaks to broad, coordinated strength.
That is what drives strong bull markets.
At the same time, defensive trades like Treasuries, the yen, and staples are near their lows.
The market is not hedging. It is reaching for growth, credit, and cyclicals.
When offense leads and defense breaks down, the Bulls usually win.
Are you still not convinced that this is a bull market? The market clearly is.
If you find my content valuable, I would greatly appreciate it if you could share it with your friends, family, and colleagues. Your help in spreading the word is invaluable in supporting our work. Thank you to all of you who share!