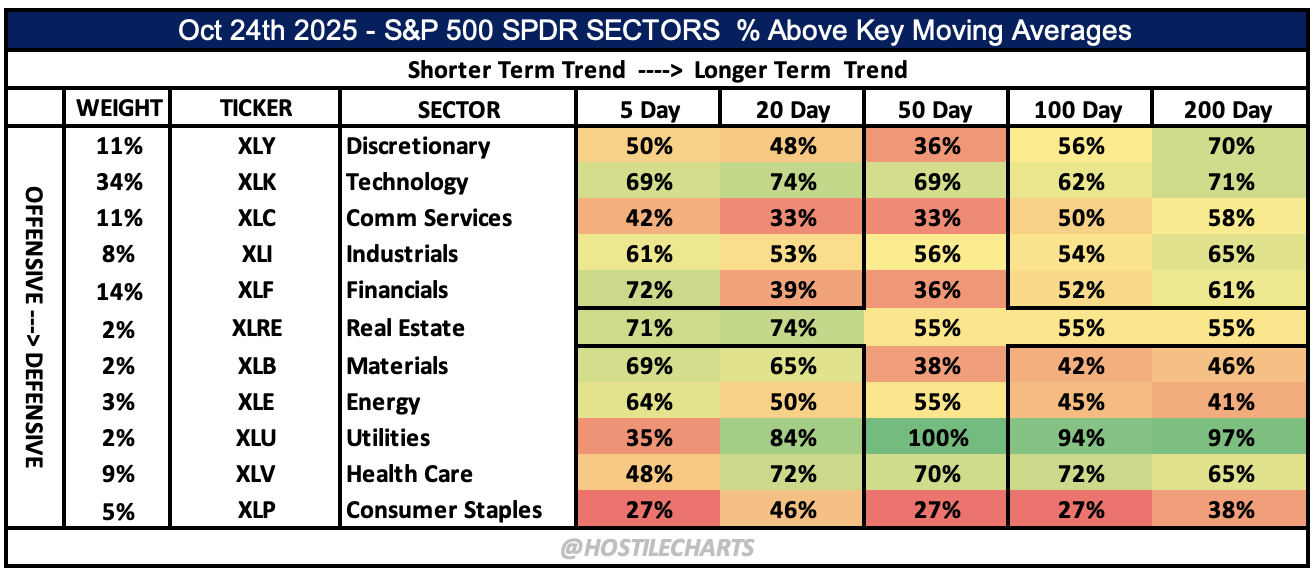
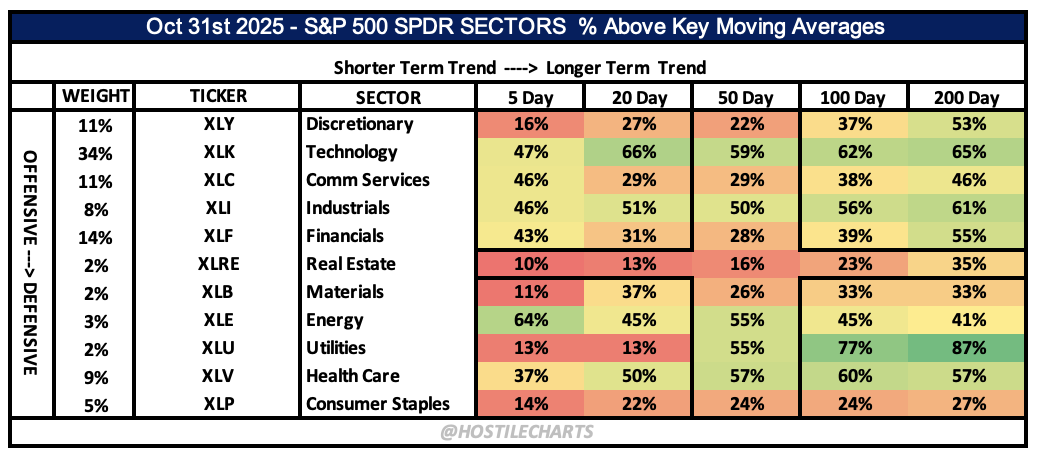
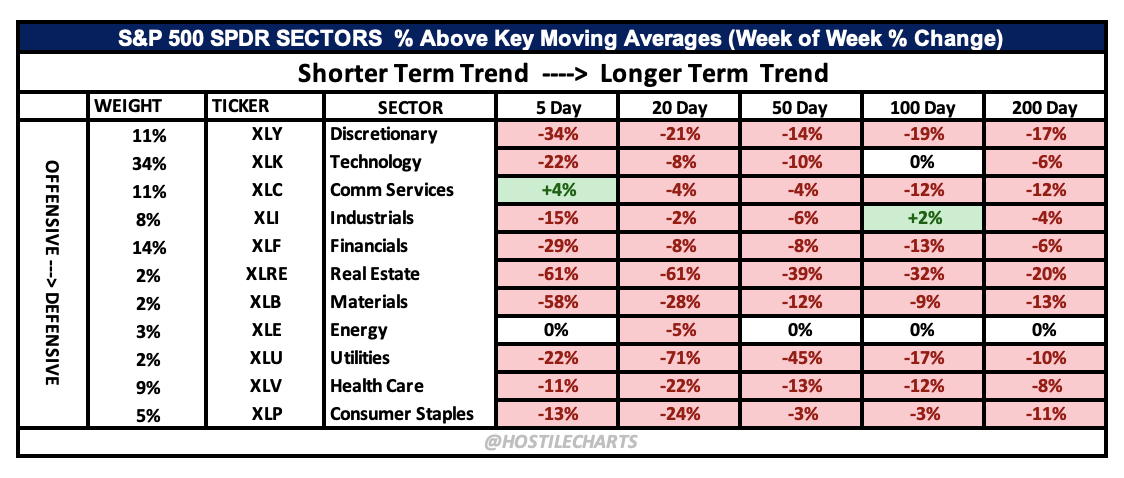
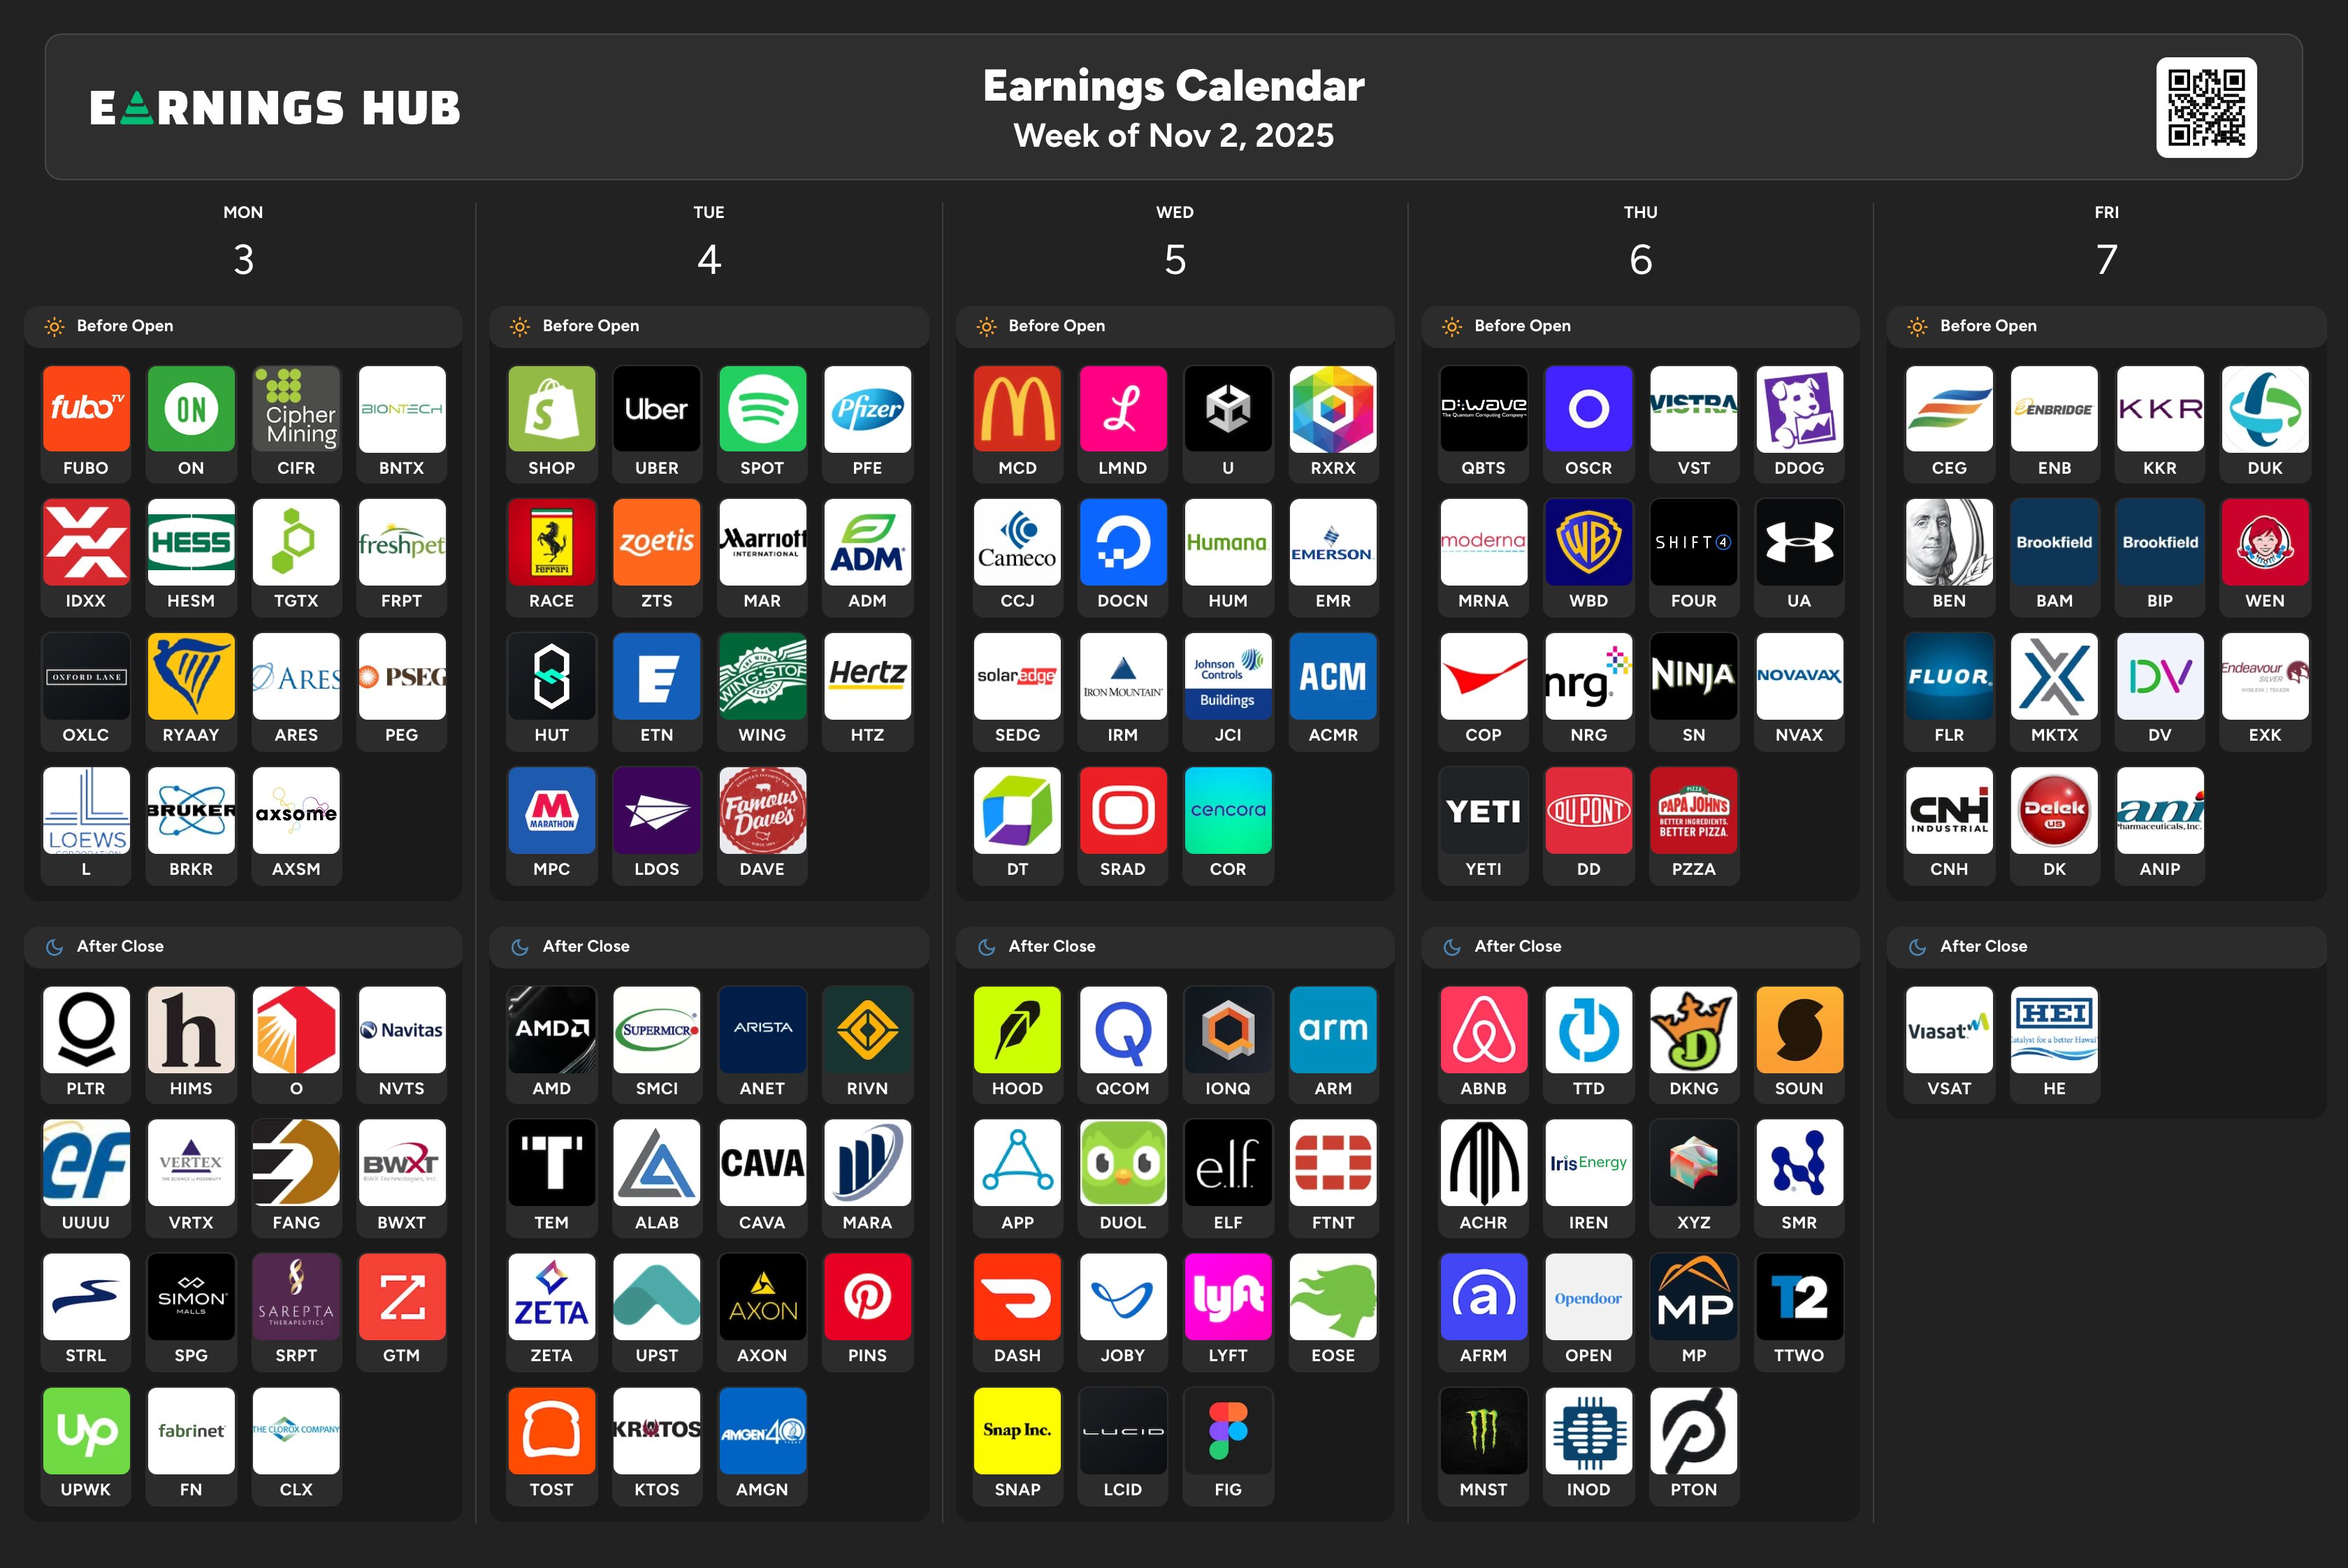
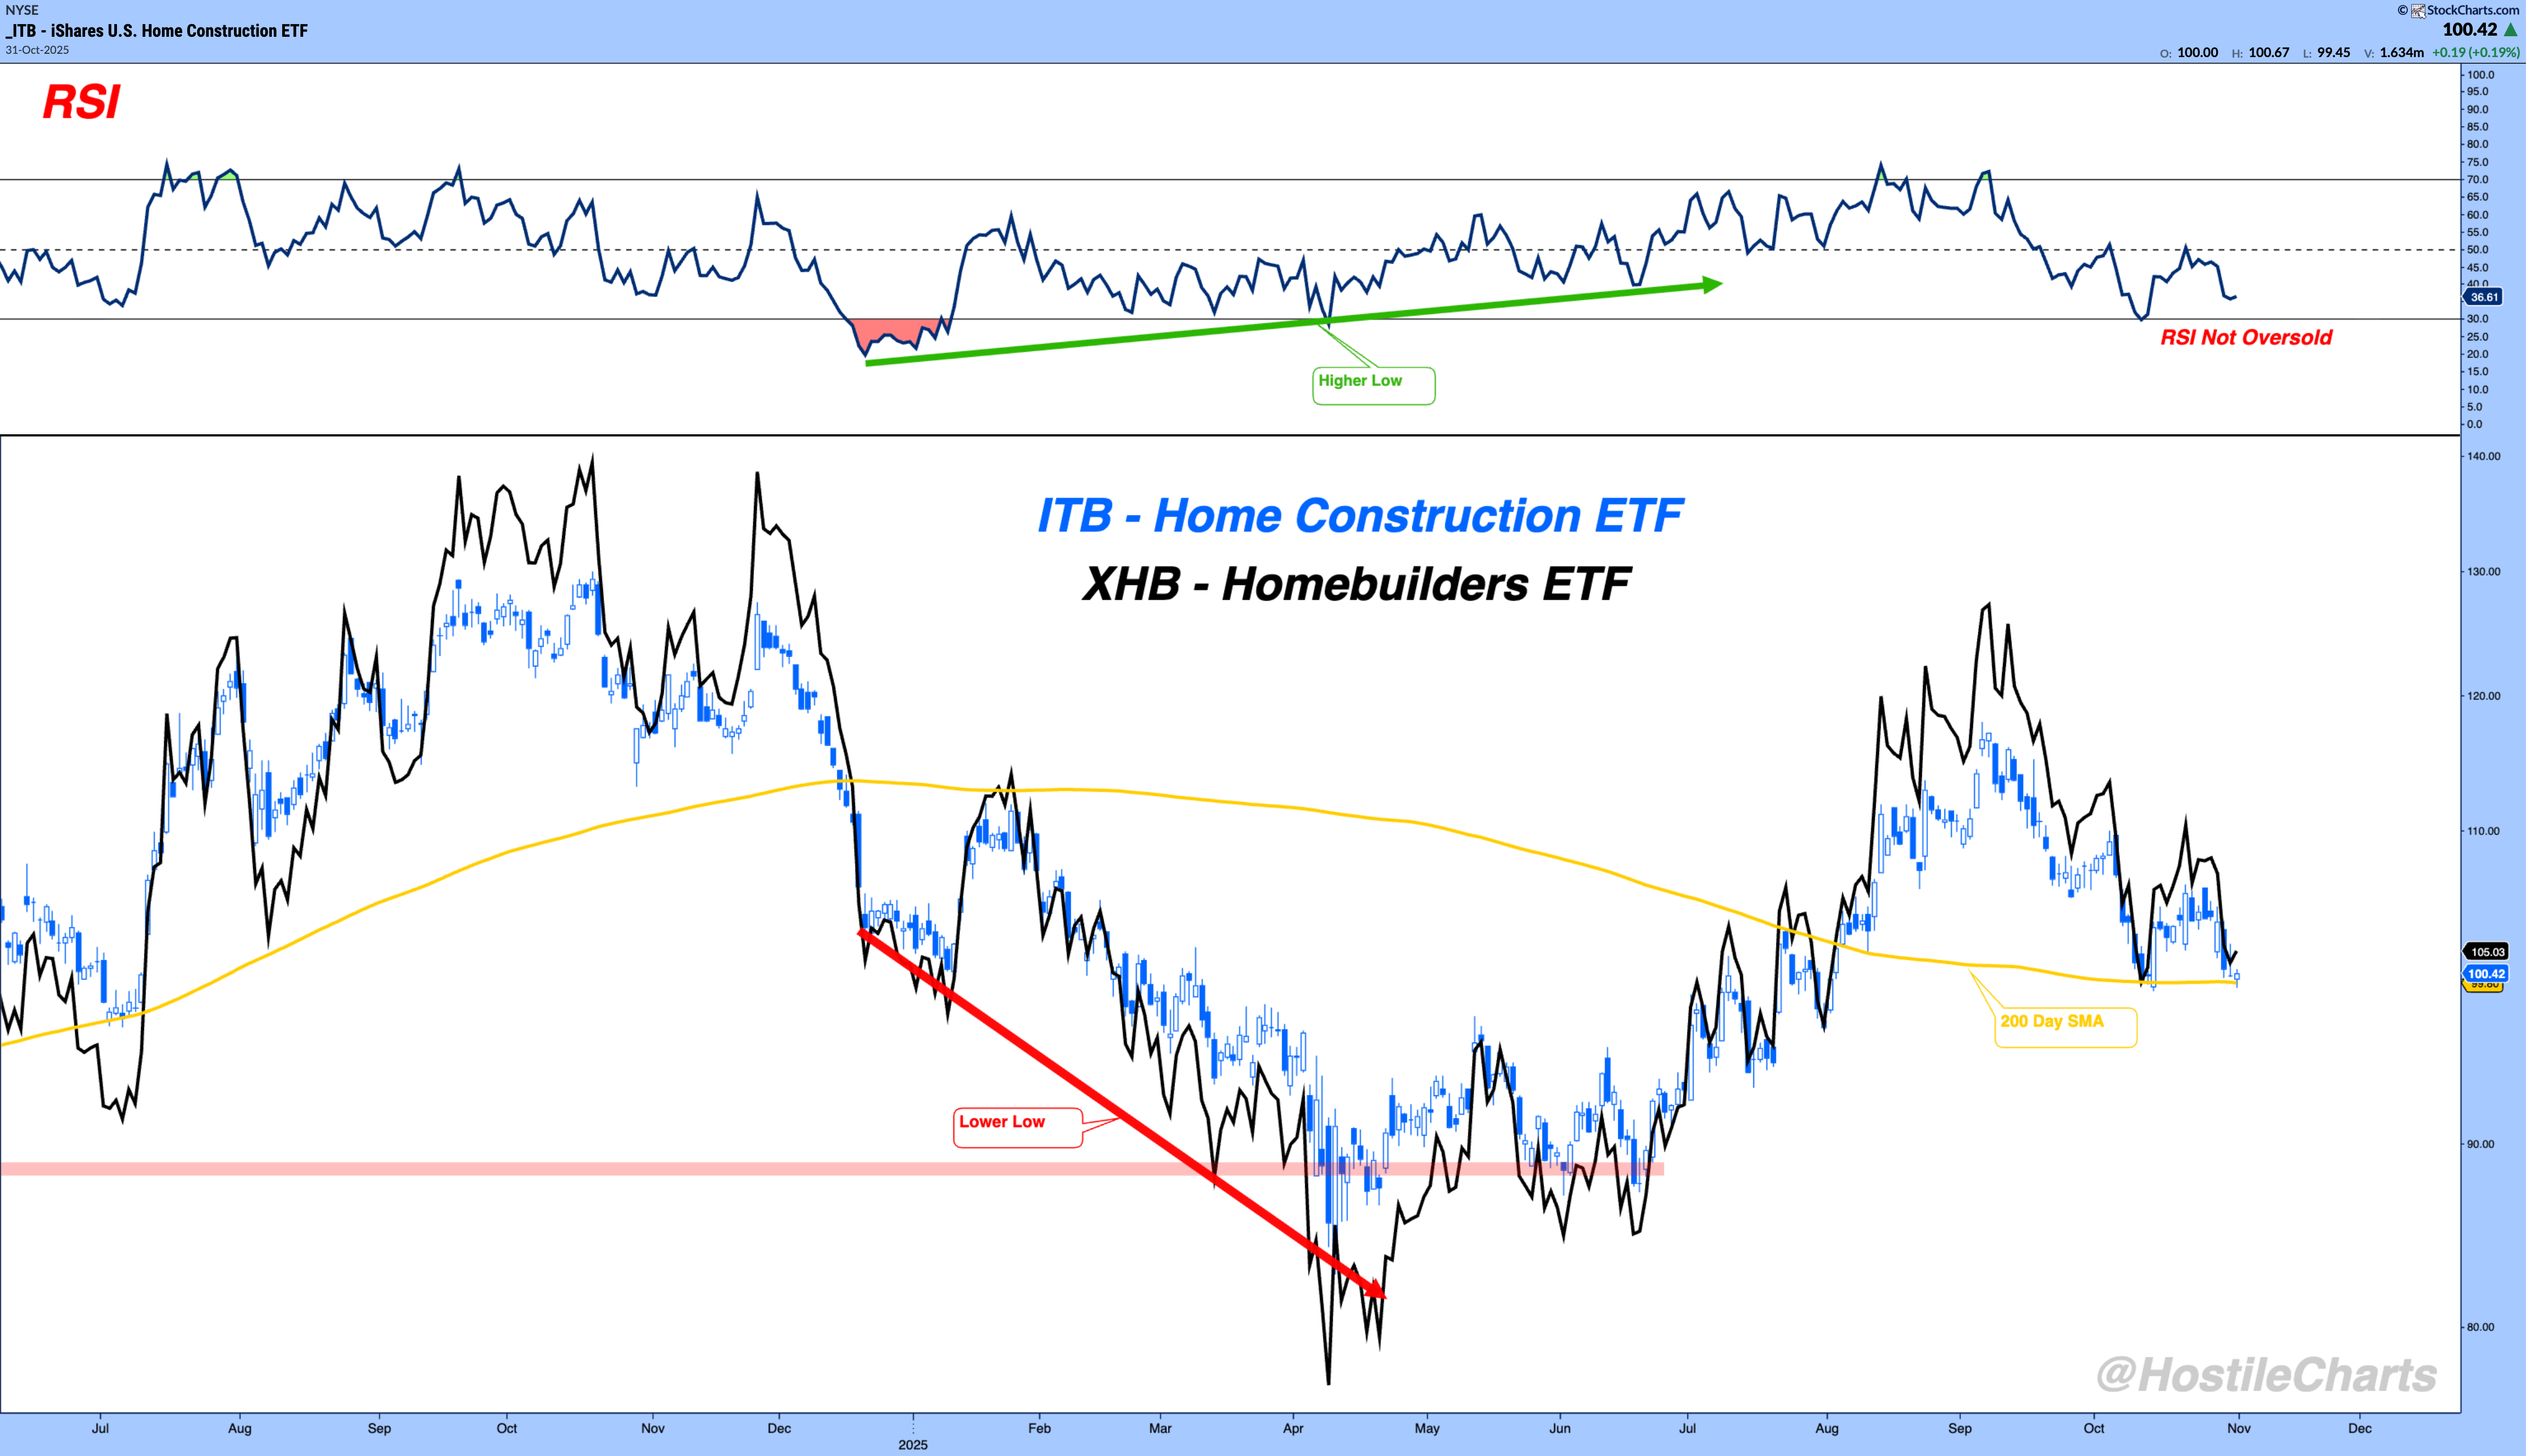
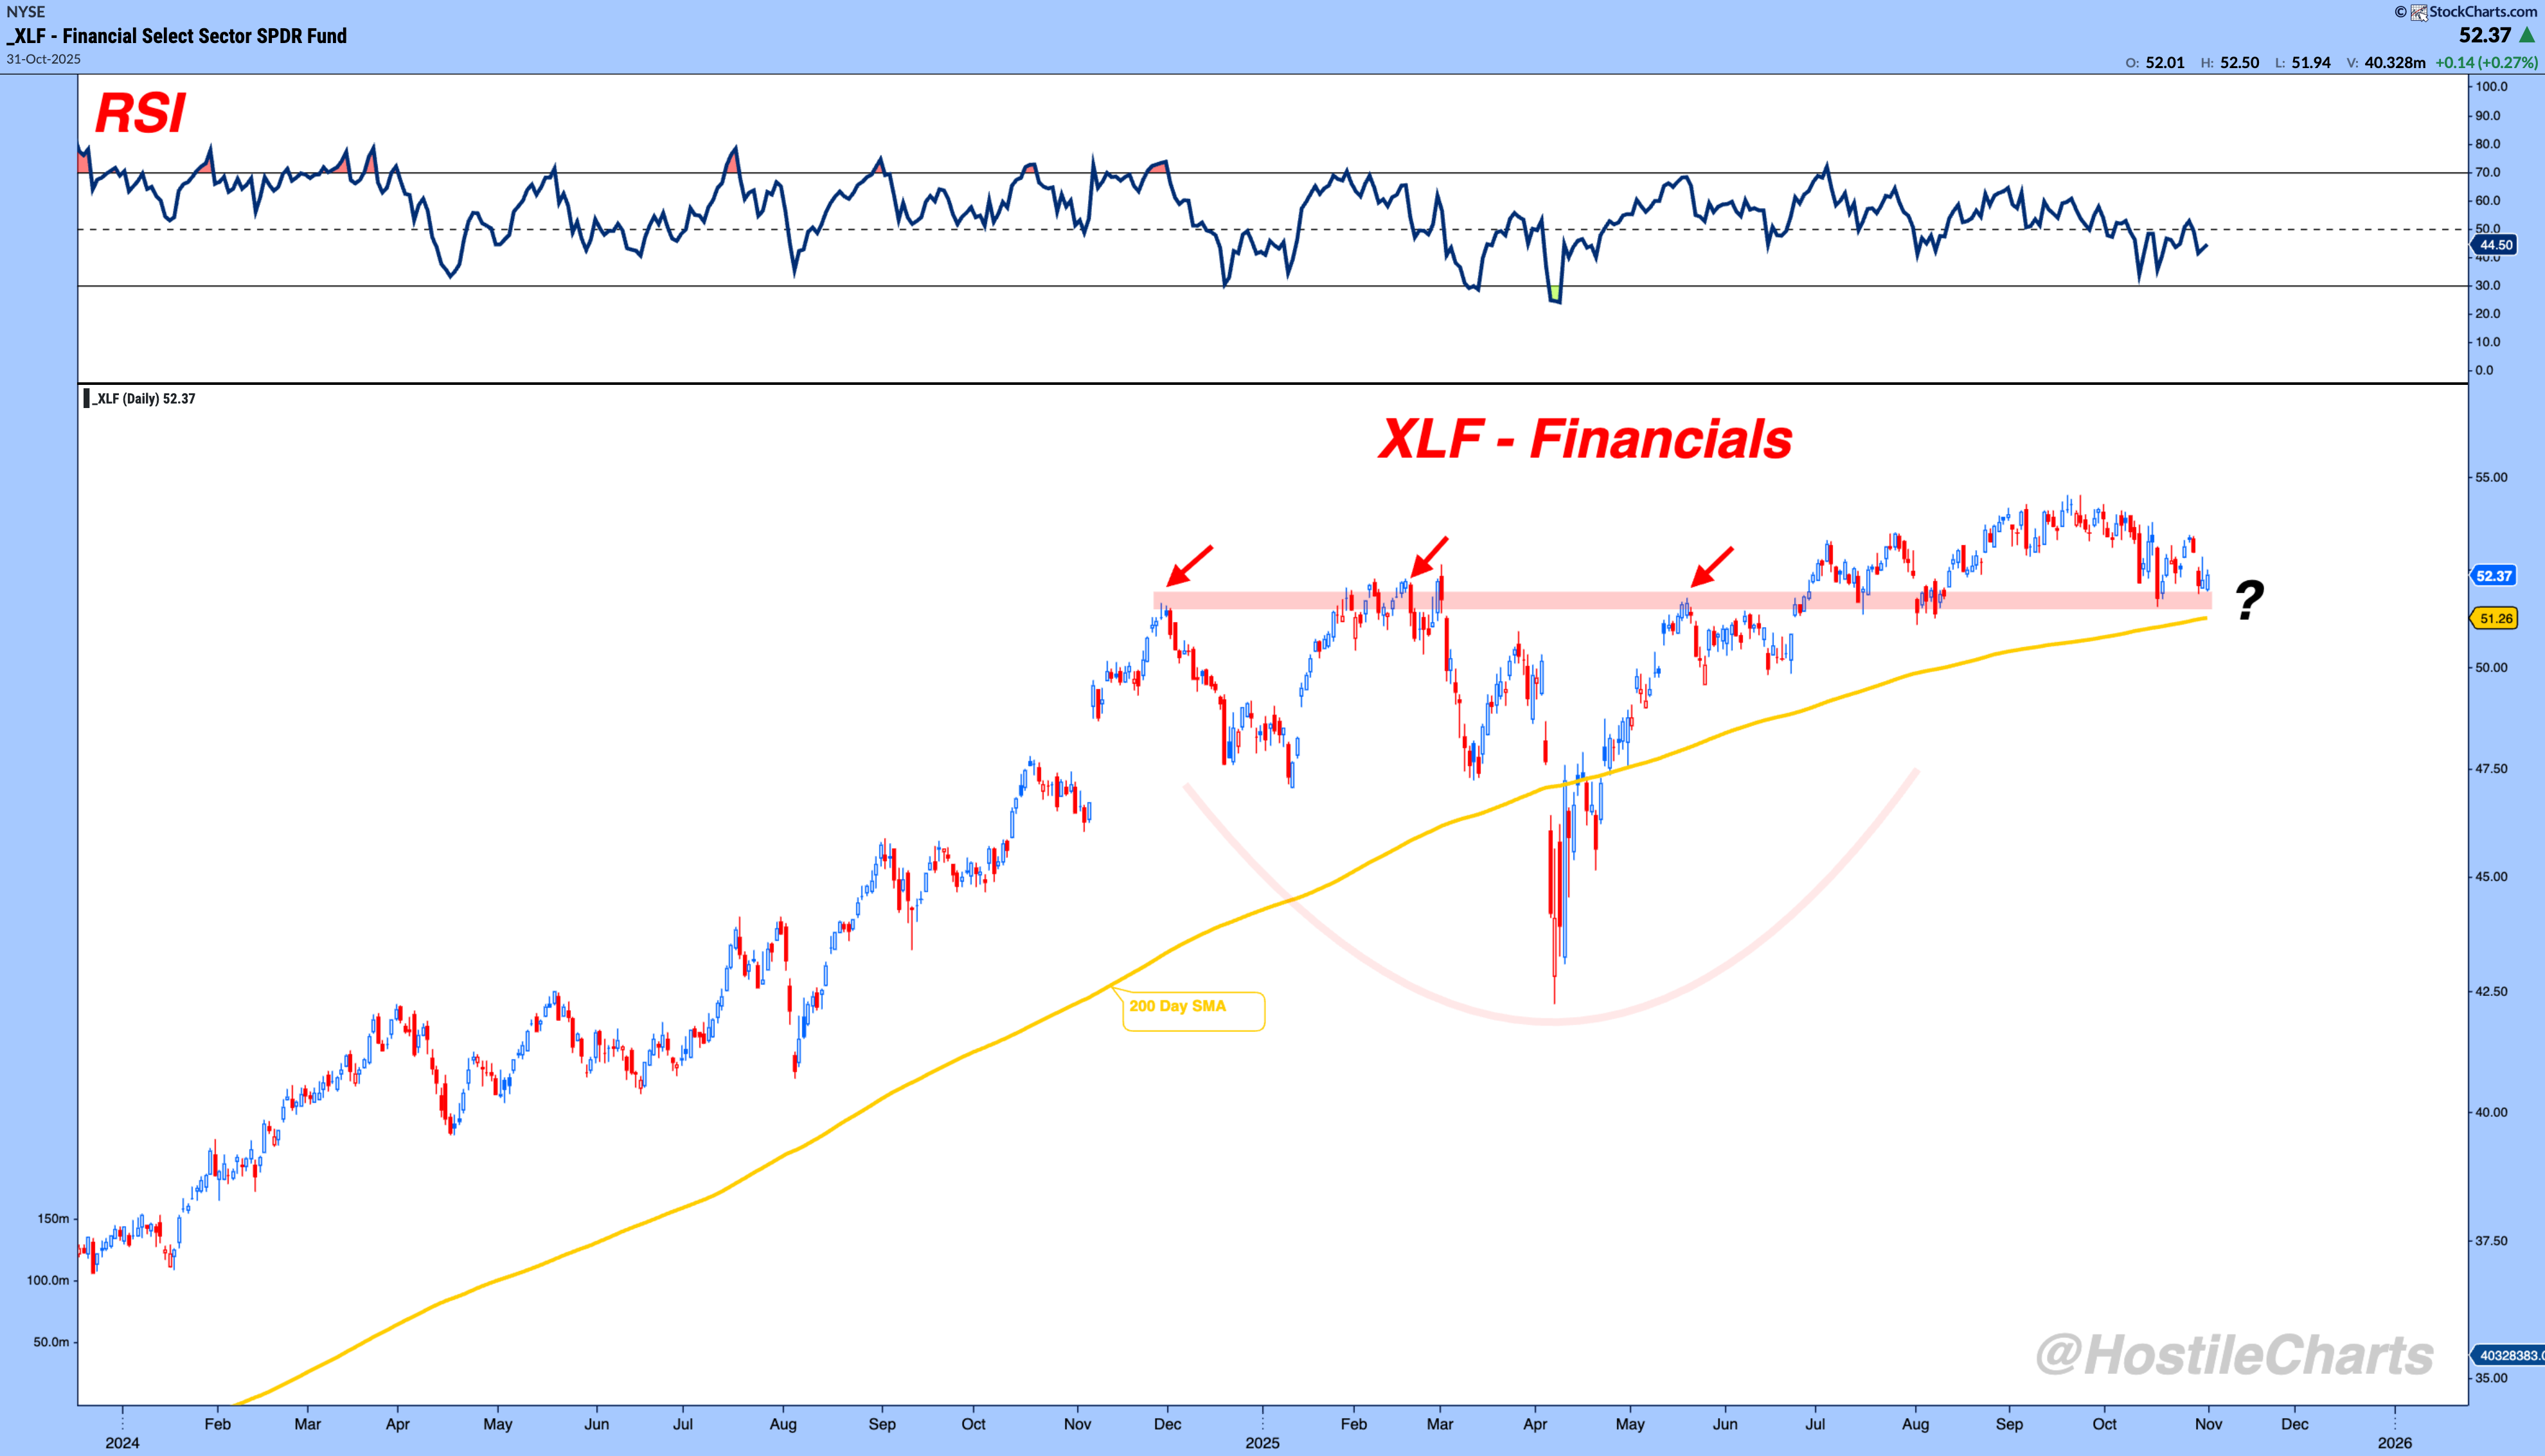
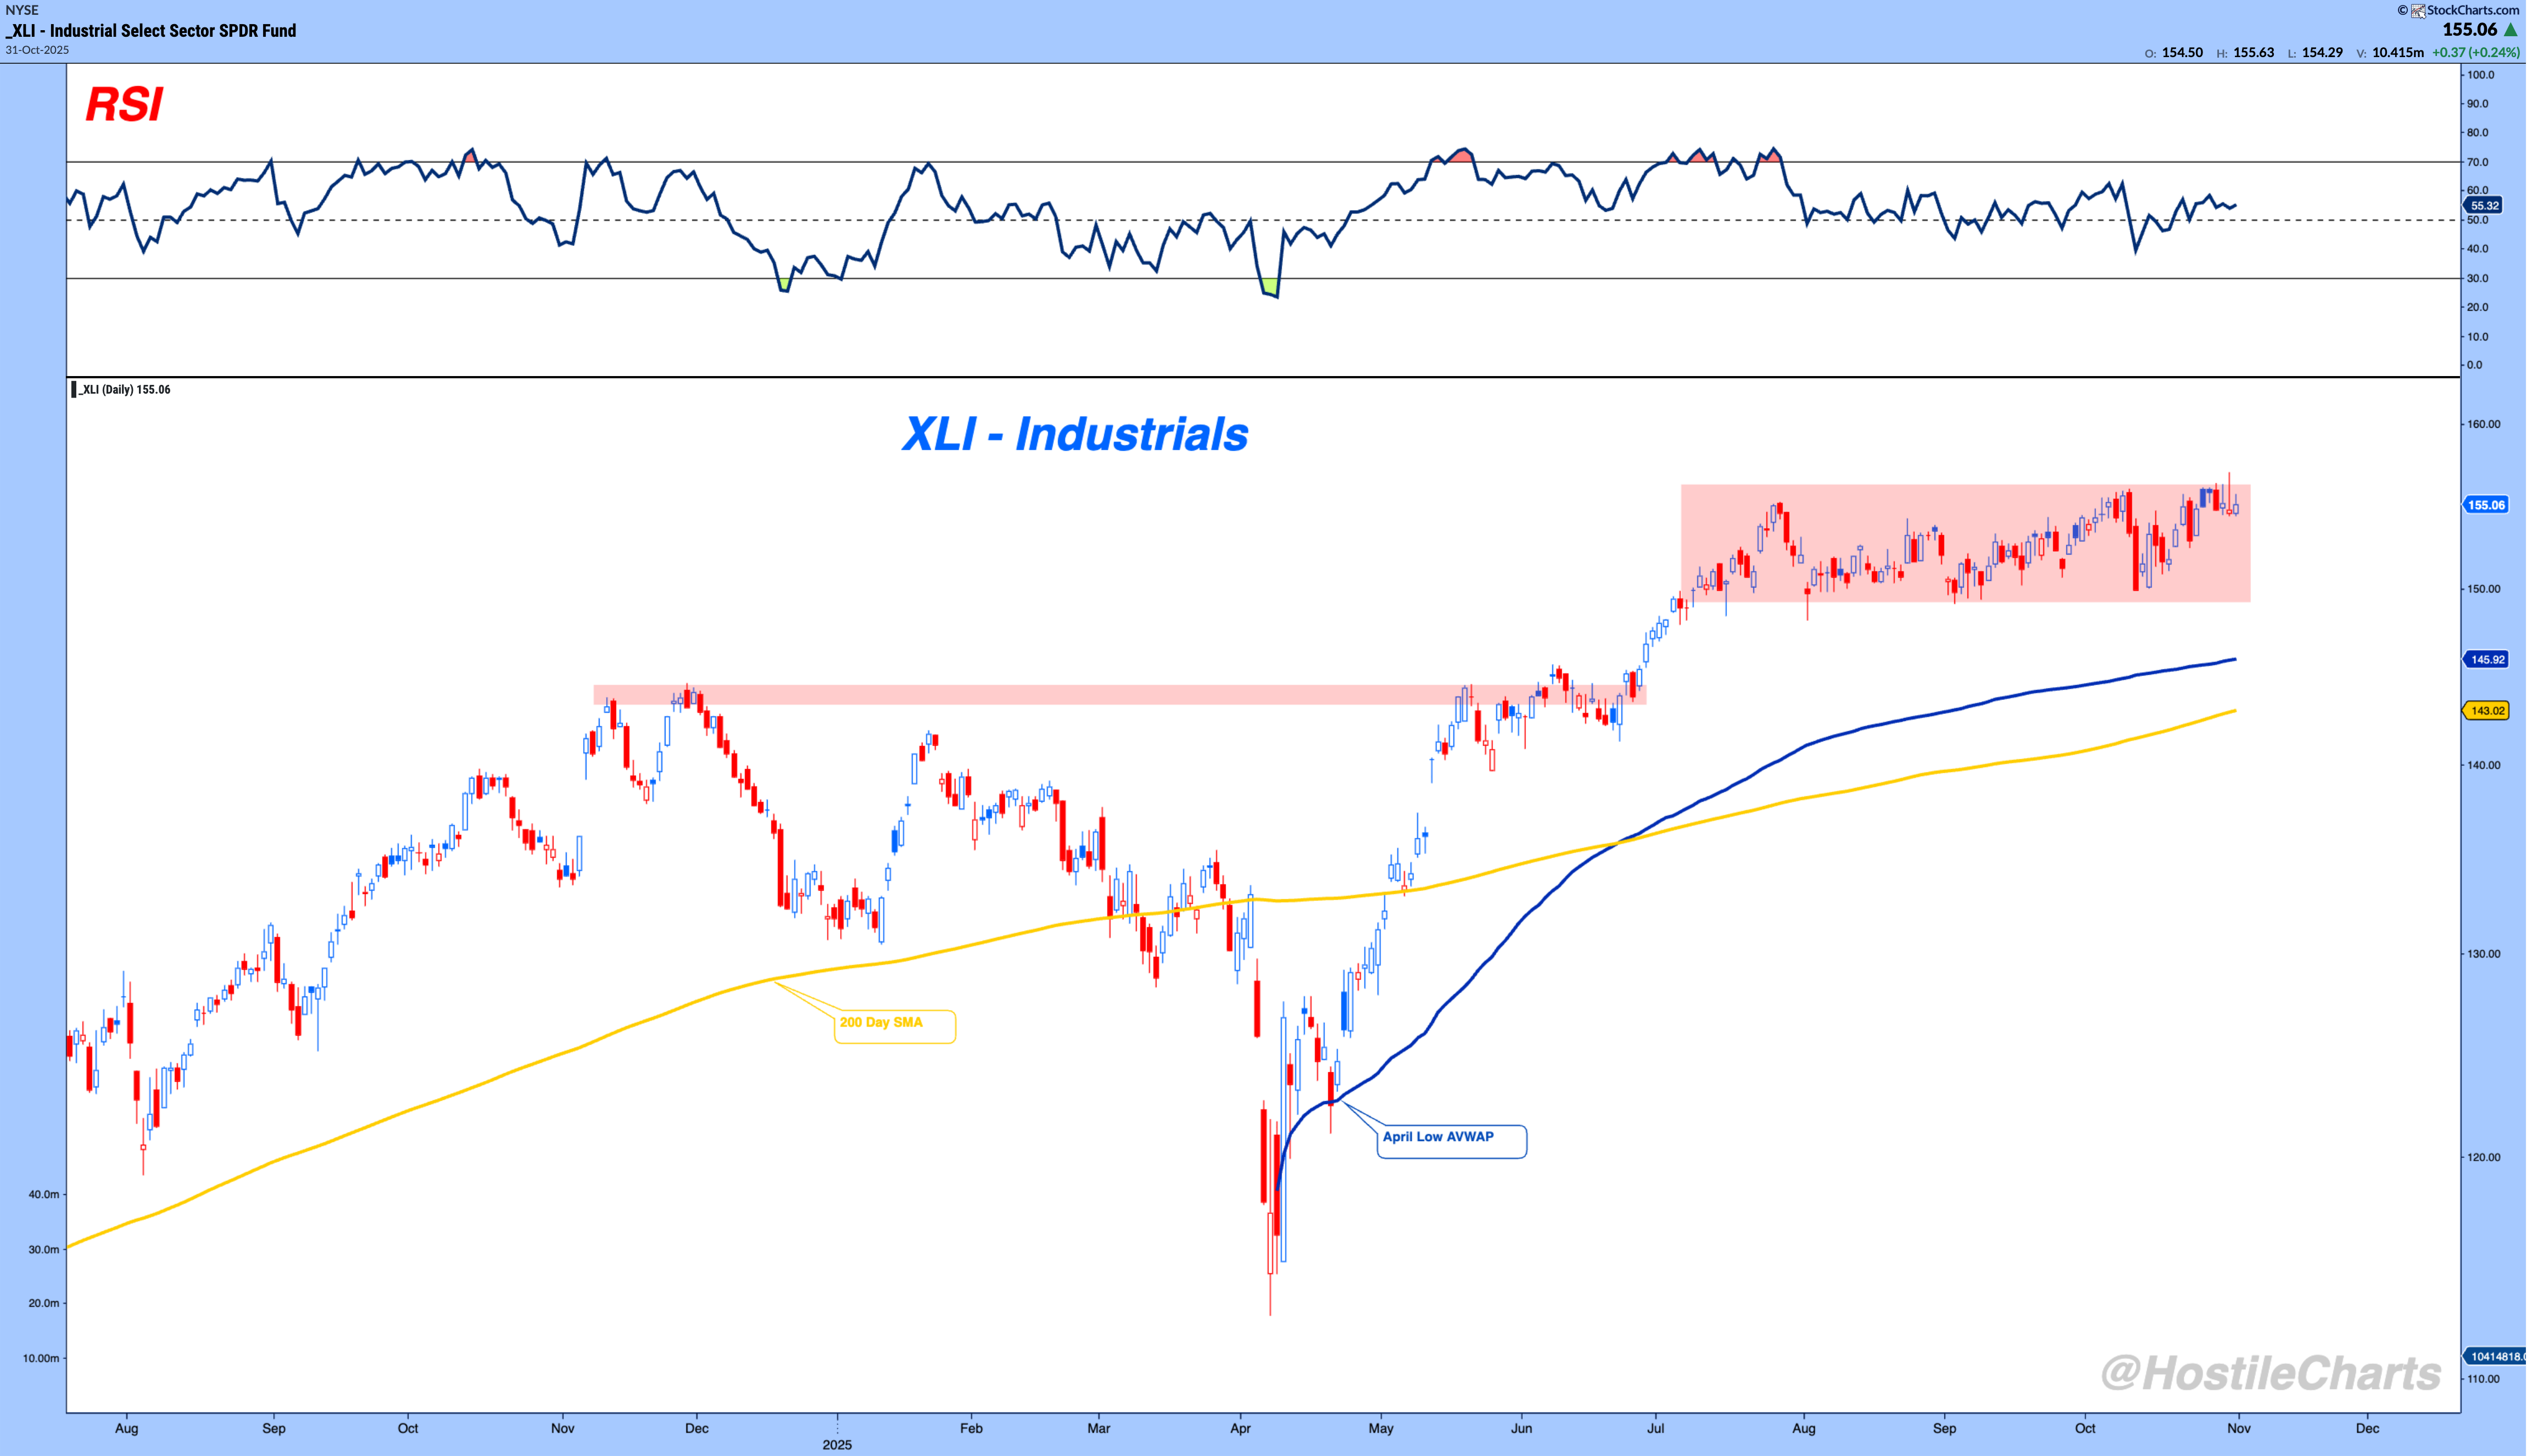
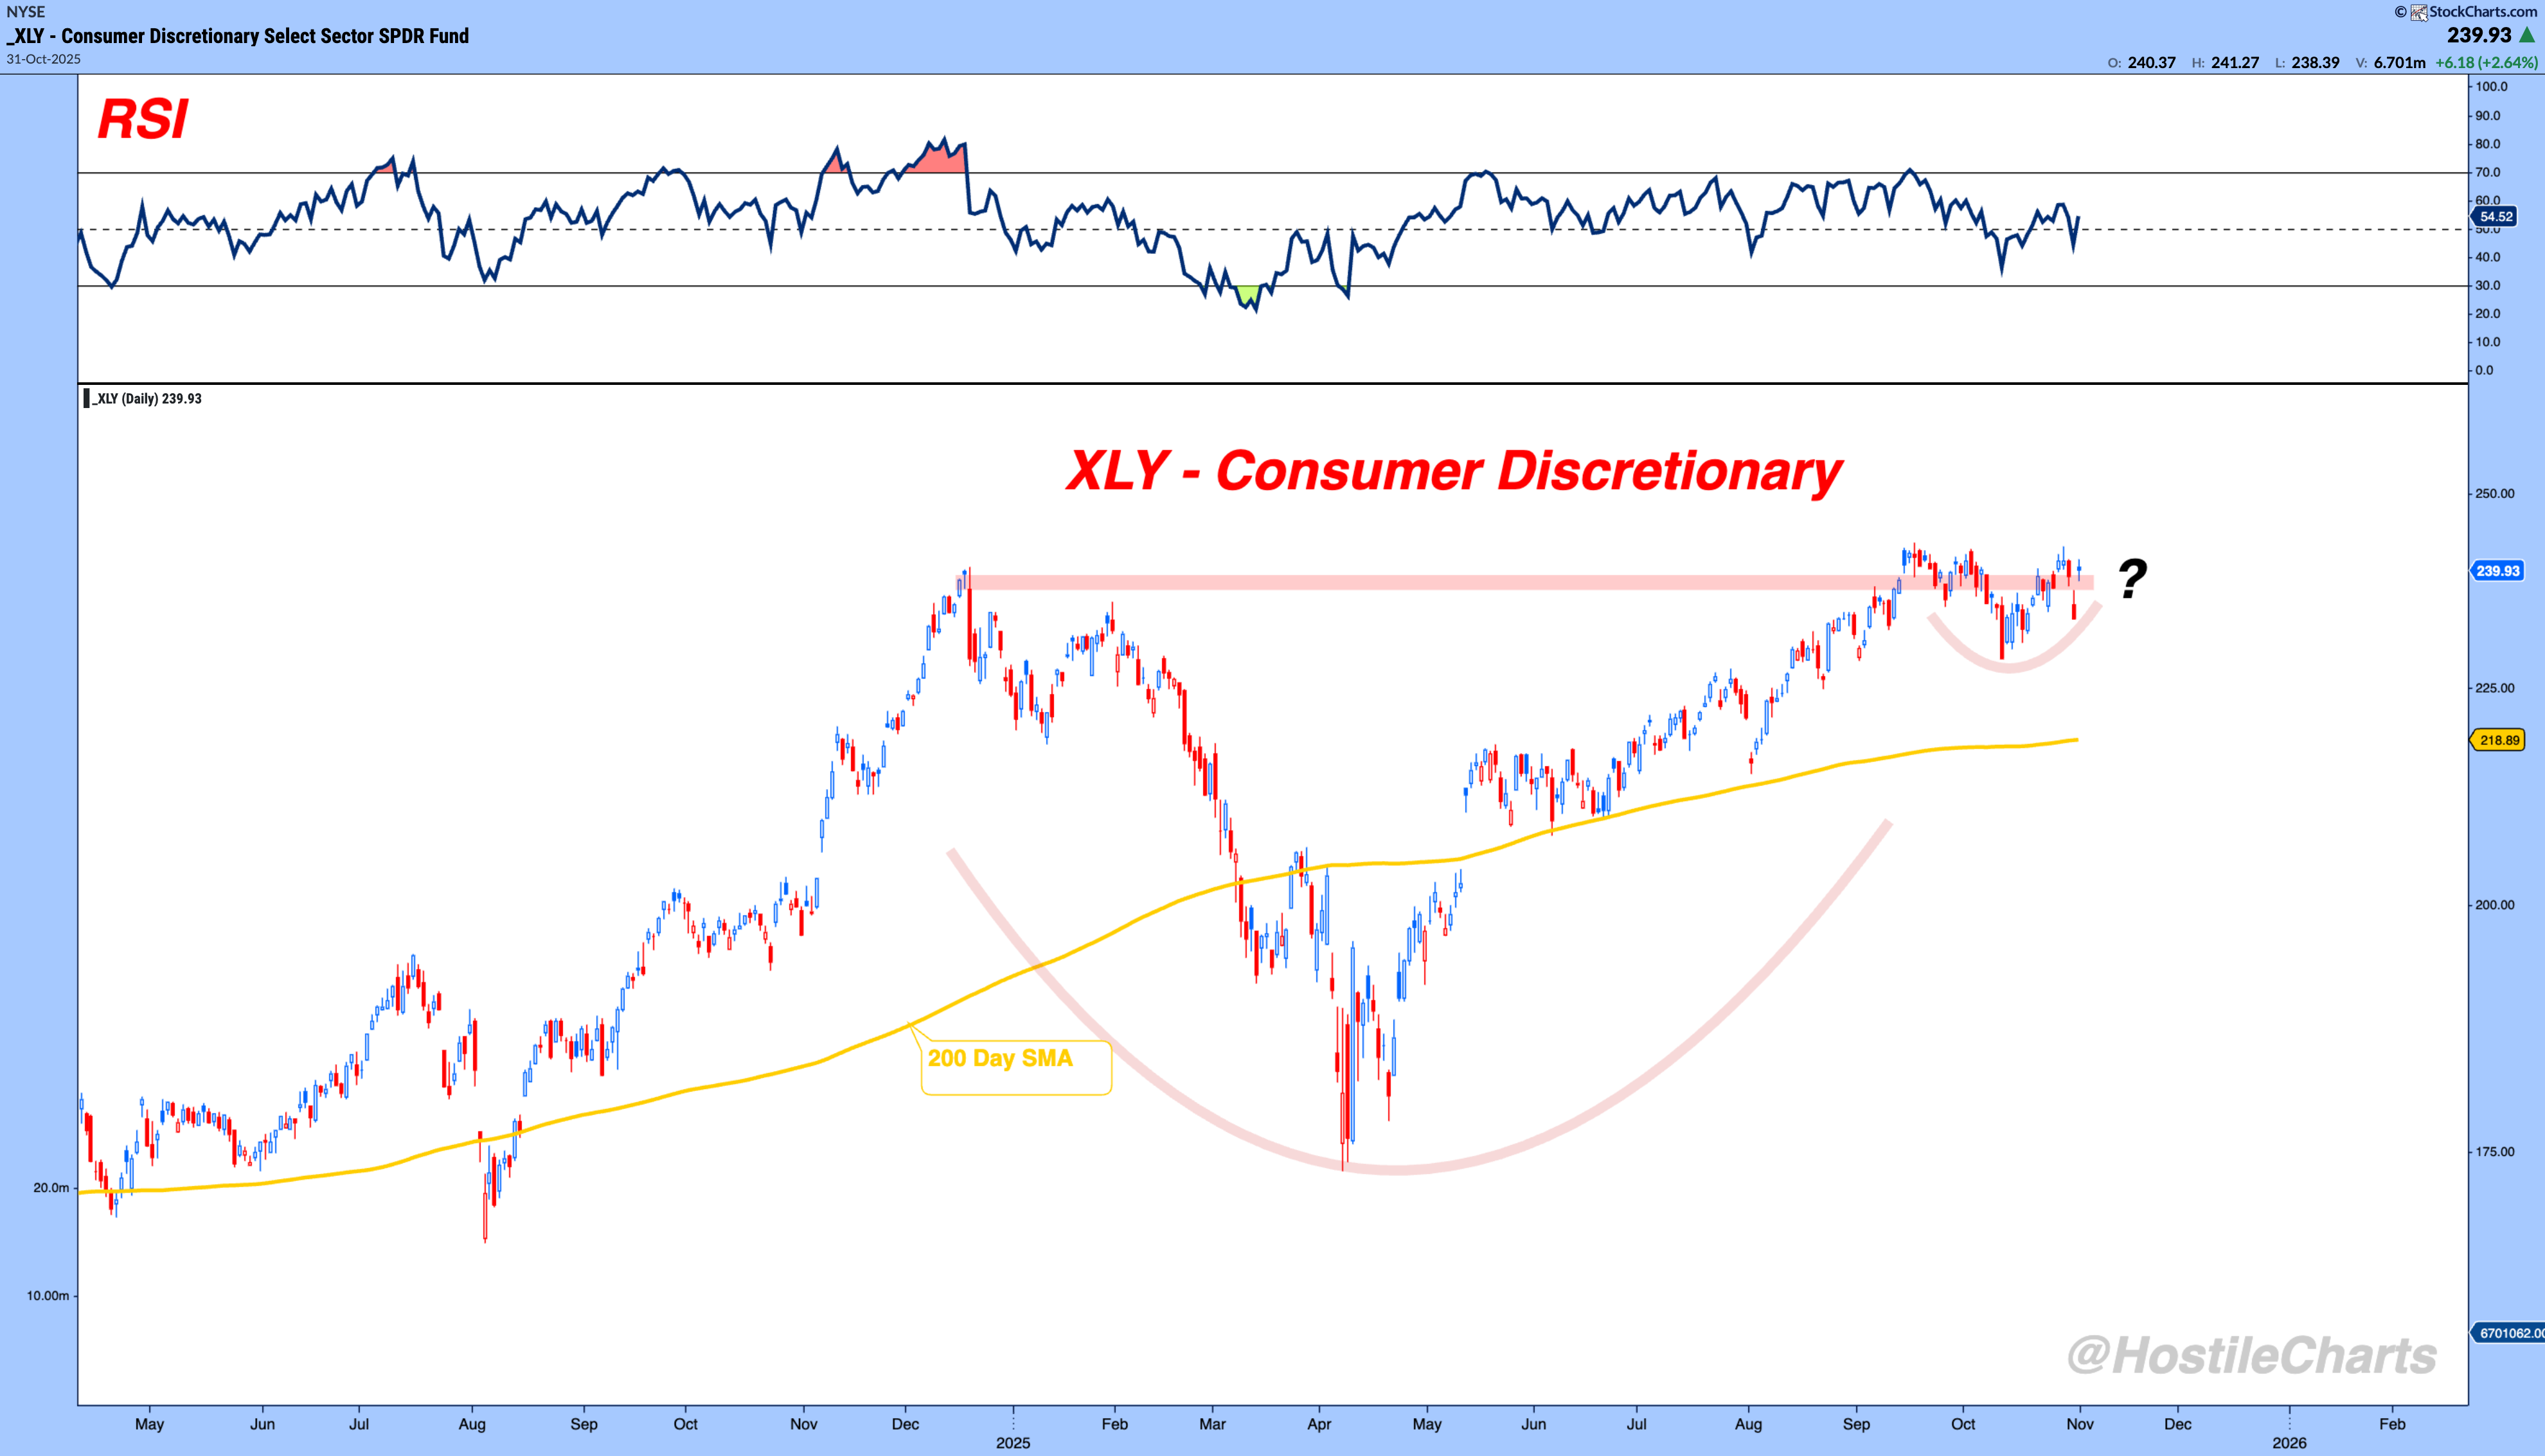
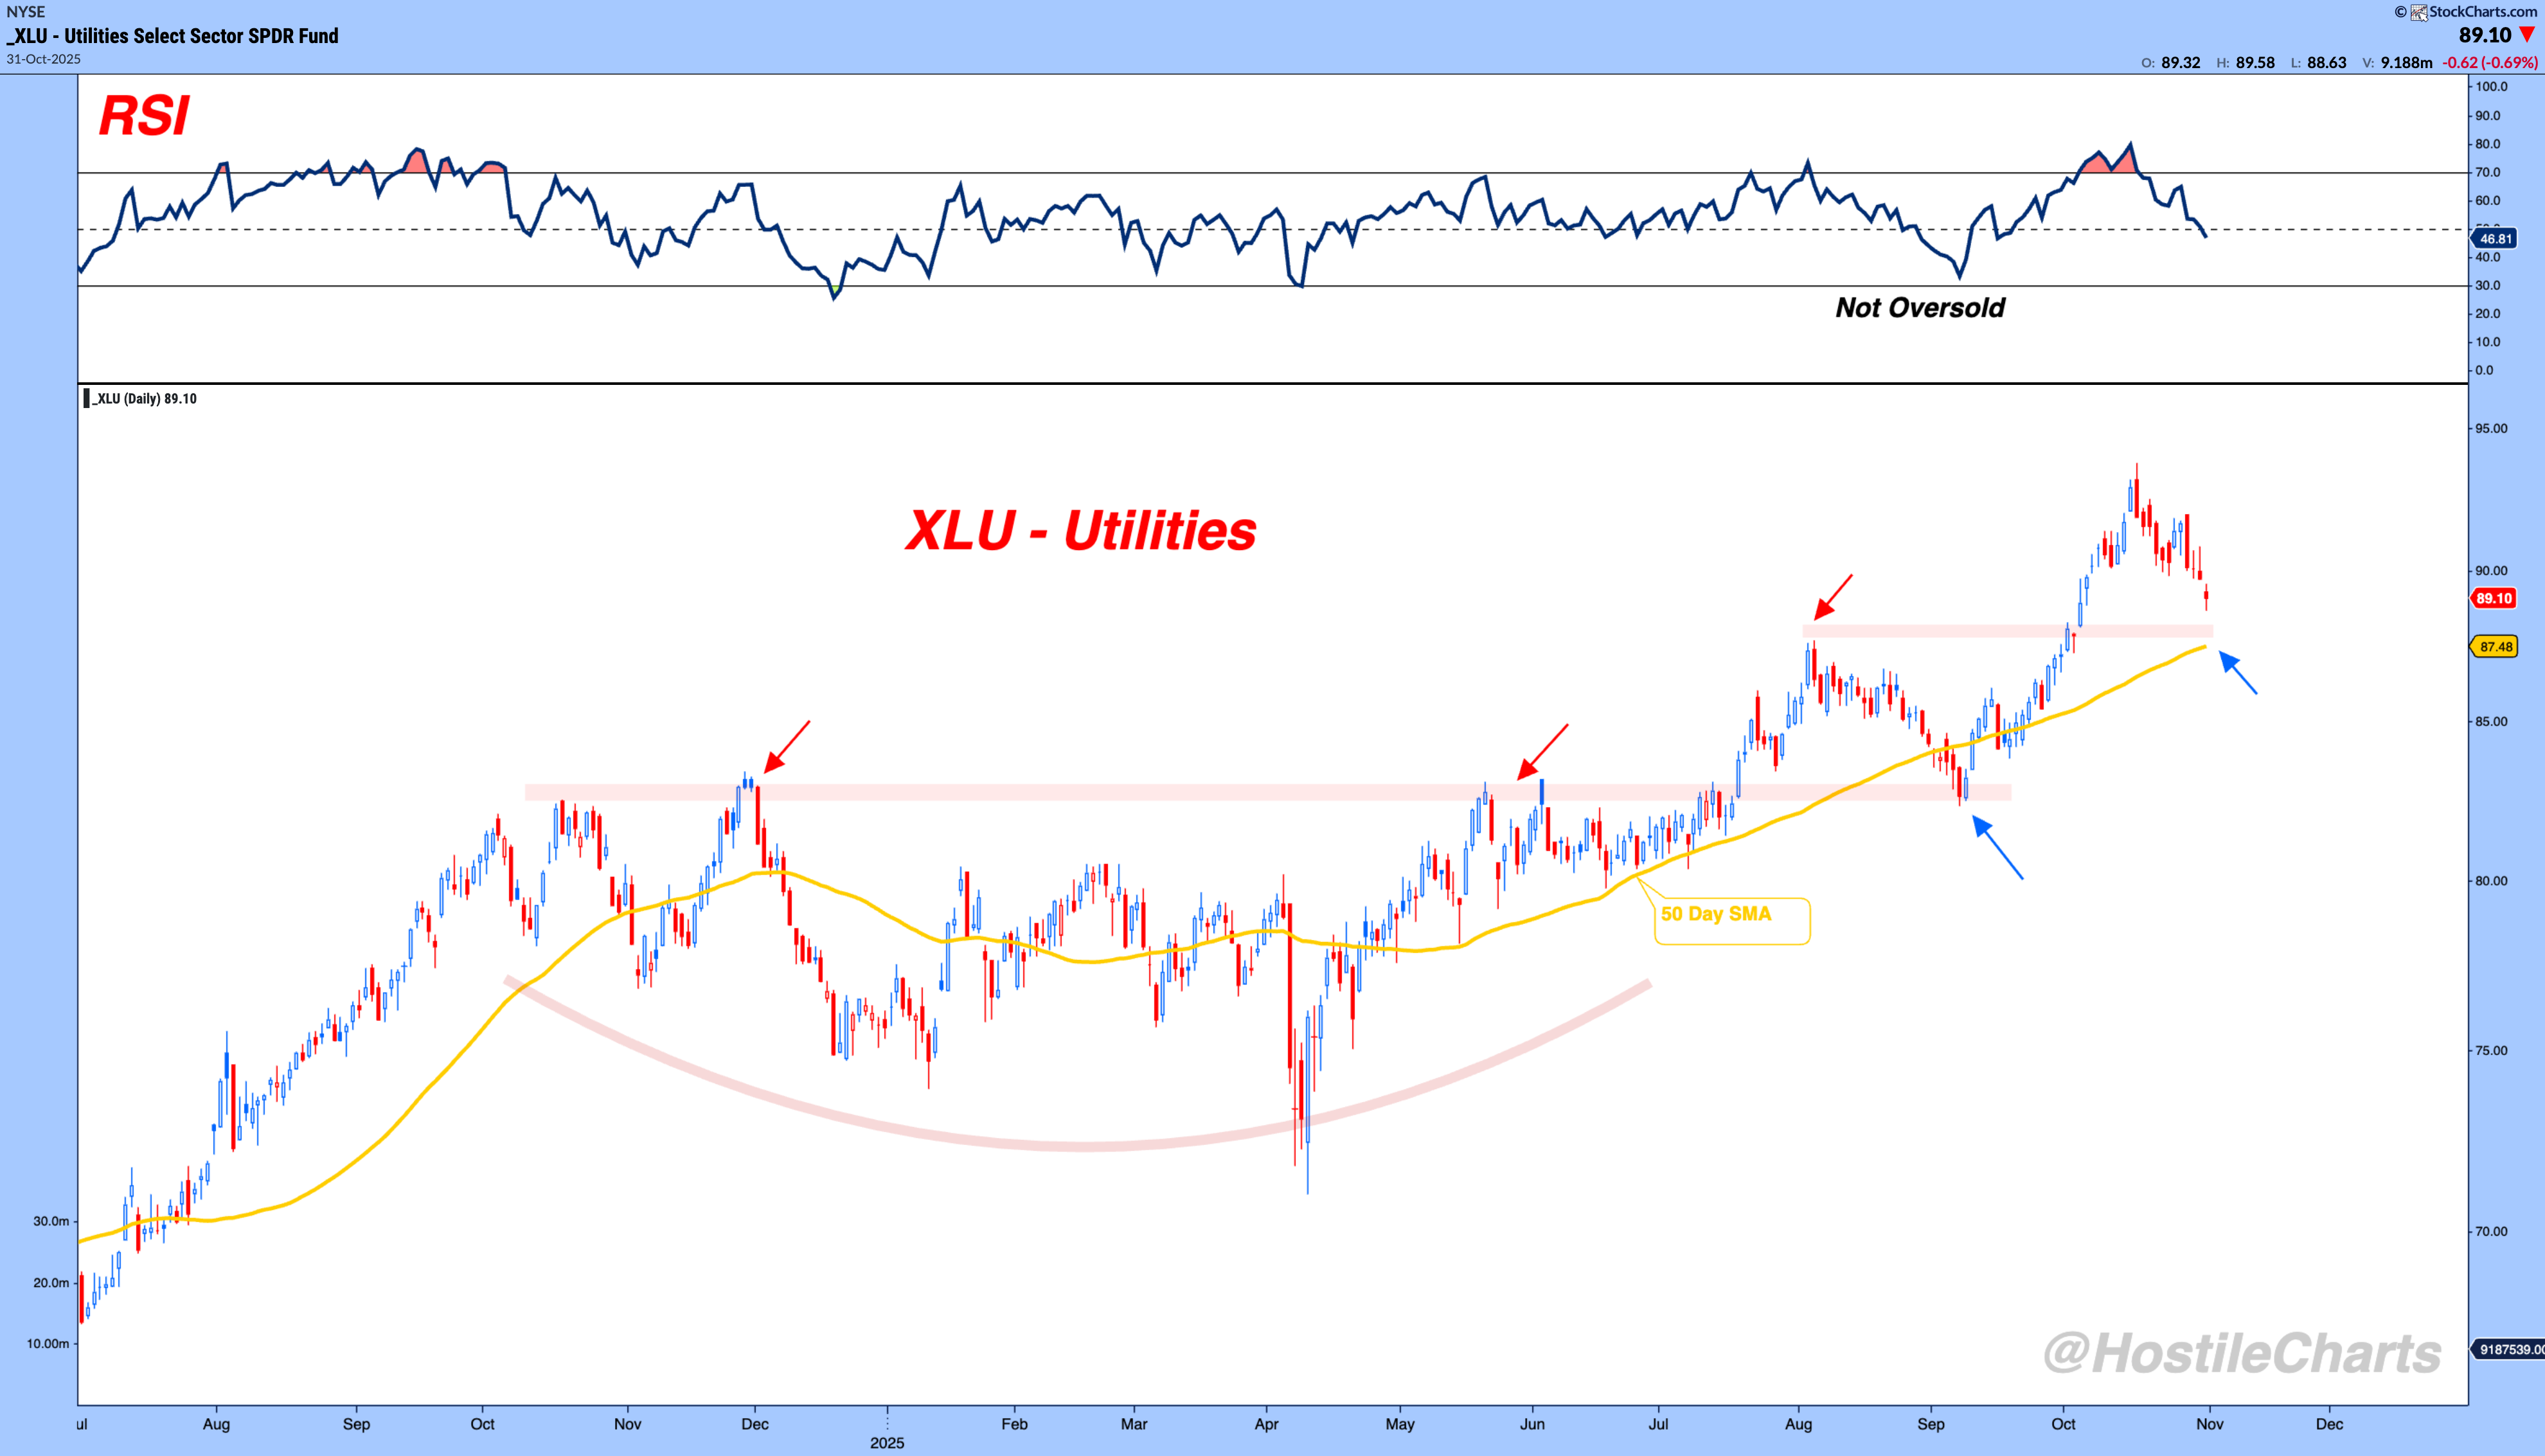
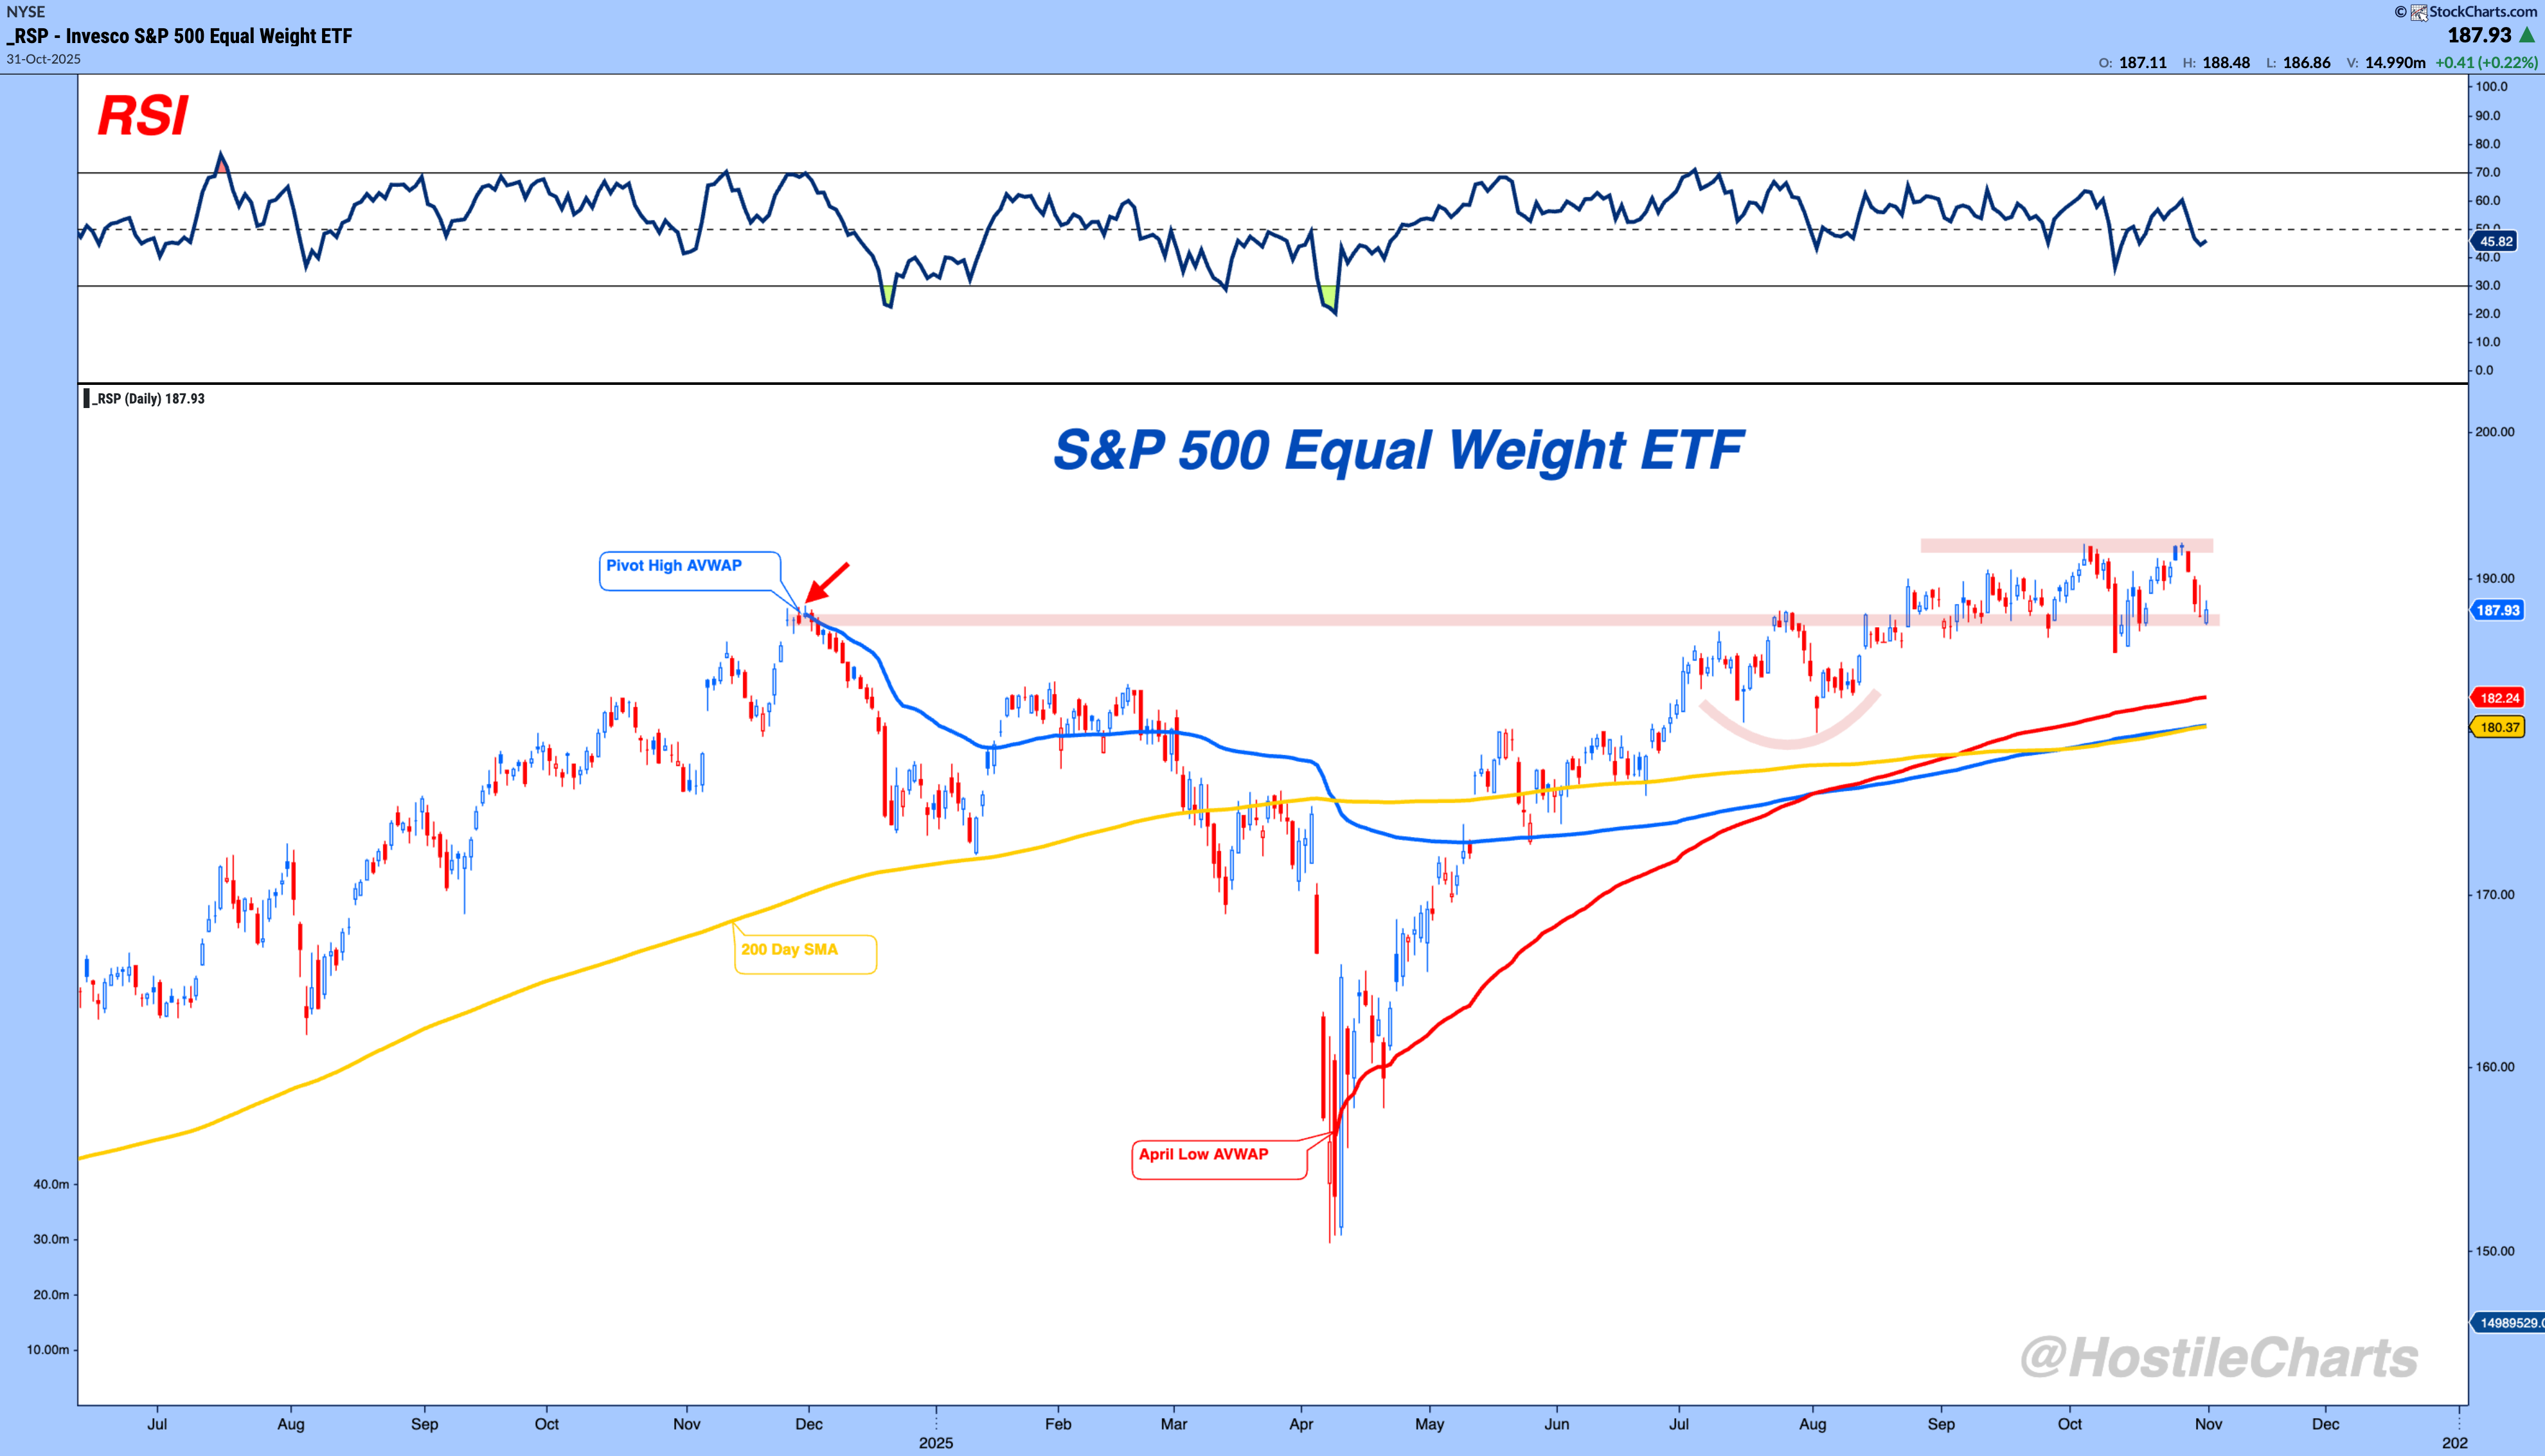
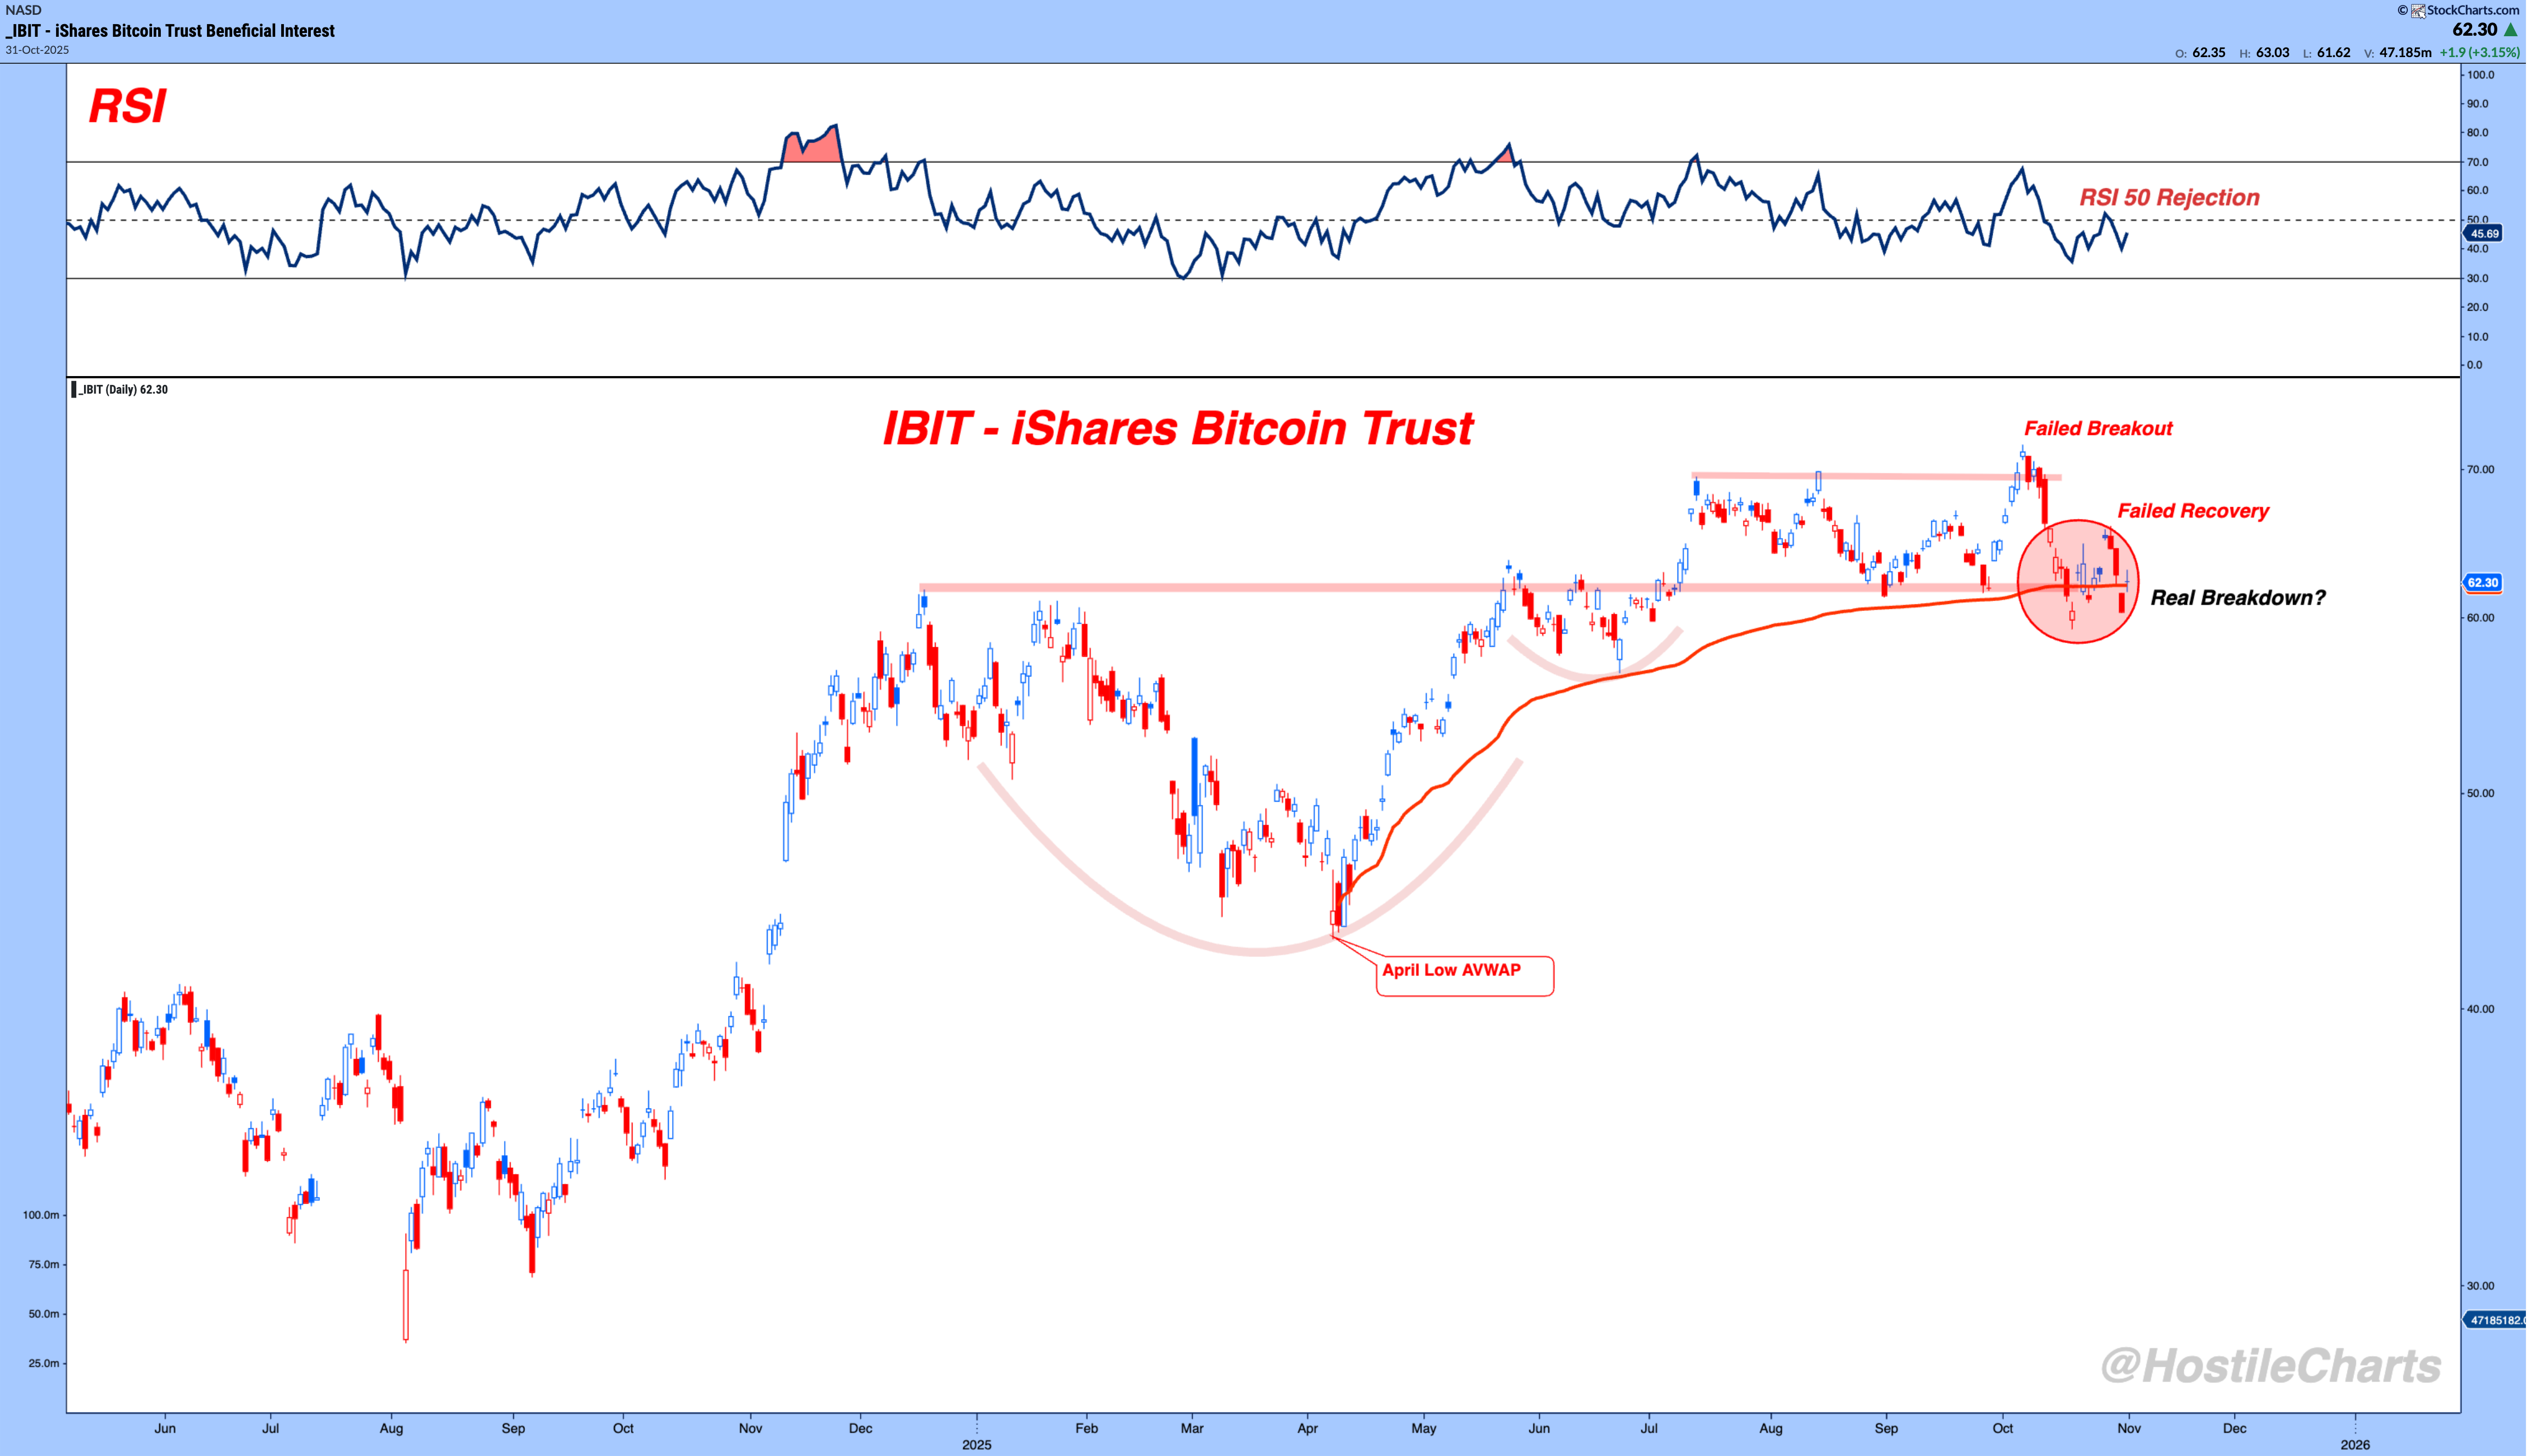
The Sunday Stalk List | Ep. 21 A "SHOW ME" Market By Larry Thompson November 2, 2025 Sunday Stalk List | Ep 21Welcome back to The Sunday Stalk List.Every weekend, I review hundreds if not thousands of charts across U.S. indices, global markets, breadth, sentiment, and intermarket relationships.And now I’m opening up my stalk list.The names that stood out the most from my review.This Week’s Theme: SHOW ME When you rip through the charts, you see something most people don’t, the individual price structure that forms the “market” so many like to quote.And right now, with the S&P 500 sitting near all-time highs, a lot of those individual charts are not confirming. Tech continues to lead, but this next leg depends on the rest of the market stepping up.It’s time for them to Show Me.Show me you can dig in.Show me you deserve capital allocation.Show me you can catch up to Tech instead of hiding behind it.Let’s get into it. Breadth - "The Market of Stocks"Breadth is something I keep an eye on every week. The "Market of Stocks" really shows the health of the underlying market. The index fails to tell the whole story when it's extremely concentrated within Tech. Breadth weakened last week - that’s not debatable. But the broader picture still looks “okay.” We’re not falling apart, we’re just consolidating.If this year-end rally is going to have legs, breadth broadening would be the tailwind that confirms it. The setup across major sectors screams Show Me. Earnings This Week Last week brought the heavy hitting names that move the indexes.This week shifts focus to single-stock risk. Stay alert if you’re holding individual positions. The "SHOW ME" Market Housing - $ITB & $XHB This is where it all starts for me: Housing.Housing stocks are sitting right at the 200-day SMA (~100 for ITB, ~105 for XHB).RSI isn’t oversold, and both ETFs are testing clean horizontal support from the spring base. If there’s any area that reflects economic momentum, it’s this one Show me housing can dig in here.Financials – XLF Financials are back testing the $51–52 zone, which lines up with former cycle highs and the 200-day SMA.Show me you can hold these prior highs and lead again. This level is too clean to ignore.Industrials – XLI Industrials are stuck inside a massive consolidation that looks like a bull flag but they’ve been chopping sideways for months.They need to show me they can break above resistance near $124–125 to confirm the next leg up.Consumer Discretionary – XLY Discretionary has one of the cleaner structures in the market with a cup and handle formation but price needs to clear the $245 zone to confirm it.Right now, XLY is hovering near $240, testing the handle low and the 200-day down near $219.Show me this is the handle setting up for new highs.Utilities – XLU Utilities have been stealth leaders this cycle, but they’re at a crossroads.The 50-day SMA sits right below current prices near $87–88, which also aligns with former resistance turned support.They’re not oversold, and the bounce setup is clean.Show me you can hold leadership here, a failure would flip one of the strongest areas into a drag.Equal Weight S&P – RSP The Equal Weight S&P is testing key support near $187–188, right where the summer consolidation began.The April AVWAP and 200-day SMA (~$180) define the bull/bear line.If we’re going to get a year-end rally, RSP needs to prove this is a pause, not a top.Show me you can base and push to new highs.Bitcoin ETF – IBIT Bitcoin’s ETF chart (IBIT) is giving off some spooky vibes.A failed breakout, a failed recovery, and now potential follow-through breakdown below the April AVWAP (~$62).Momentum rolled over after a weak RSI-50 rejection. Show me this isn’t a topping pattern.My Two Cents We’re still in a Bull Market, but this is one of those pivotal stretches where leadership needs to broaden.We’ve seen this setup before. The bears get loud right as charts start to rip in their face.So, yes, you can hold your nose and buy some of these levels as the risk is so well defined. But this is a Show Me Market.If the year-end rally is coming… Show Me.Cheers. Thompson's Two Cents Larry Thompson delivers timeless trading lessons and market wisdom in quick daily notes. More from Thompson's Two Cents Larry Thompson The Sunday Stalk List | Ep. 40 The Hopeful "Bounce" March 15, 2026 Larry Thompson Methods For A Messy Market Honesty Matters.... March 12, 2026 Larry Thompson It's Messy That's Ok March 10, 2026 Trade Smarter With Larry’s TakeThompson’s Two Cents offers concise market wisdom, timeless trading lessons, and chart-driven perspective you can trust. You must have JavaScript enabled to use this form. Email More from Thompson's Two Cents Thompson's Two Cents Watch Now