For the first time in 25 weeks, more stocks made new lows than new highs across the NYSE and NASDAQ.
Here’s the chart:
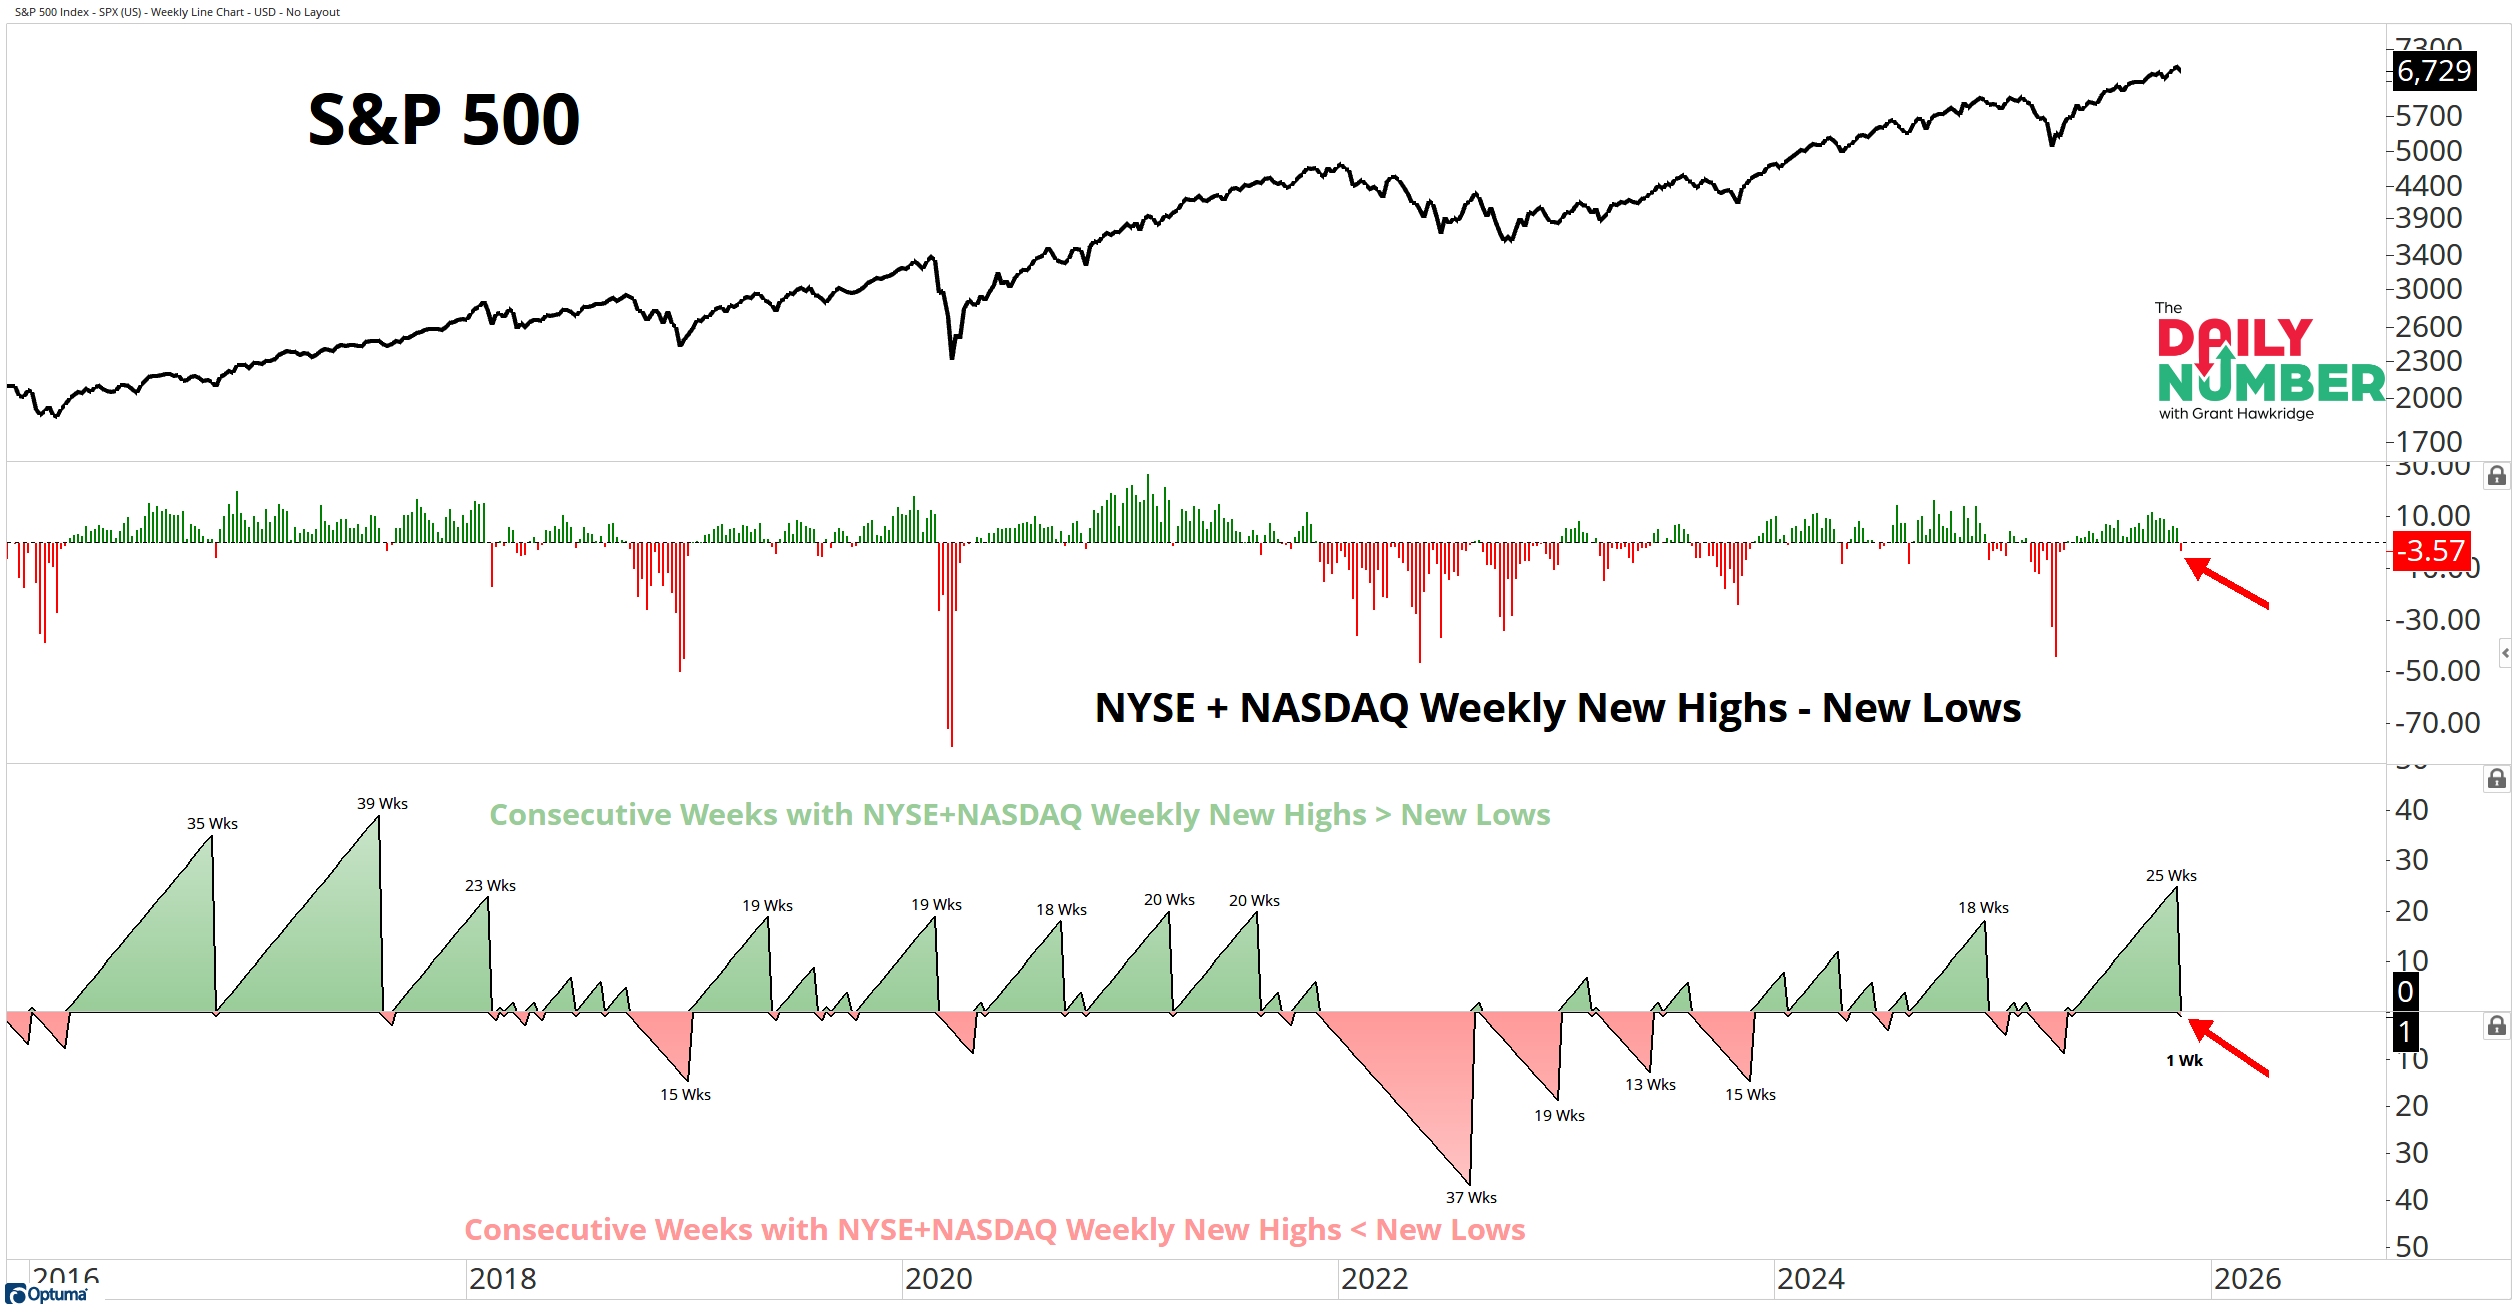
Let's break down what the chart shows:
The top panel shows the S&P 500 weekly price in black.
The middle panel displays a histogram of NYSE + NASDAQ weekly new highs minus new lows, with green bars for positive readings and red bars for negative ones.
The bottom panel shows consecutive week counts of those readings, with green marking positive streaks and red showing negative ones.
The Takeaway: This is the first time since April that new lows outnumbered new highs. The current reading sits at –3.6%.
That is not a panic signal.
It is mild deterioration after a long stretch of internal strength.
Breadth runs like this do not last forever. 25 straight positive weeks ranks among the strongest since 2017. When these streaks end, markets usually pause or digest gains rather than reverse outright.
The S&P 500 remains above both its 50-day and 200-day moving averages. Those streaks now stand at 133 and 126 days, showing price still sits comfortably in an uptrend. The 50-day also remains above the 200-day, a key condition of trend health.
If a pullback does occur, a 10% drop would line up with the February 2025 highs and the 200-day moving average.
That zone marks a logical support level.
Until new lows spike closer to –10% or worse, the evidence points to cooling, not cracking.
The real test now is whether breadth can catch its breath and rebuild, or if this is the start of something deeper.
If you find my content valuable, I would greatly appreciate it if you could share it with your friends, family, and colleagues. Your help in spreading the word is invaluable in supporting our work. Thank you to all of you who share!