Two key market models are both green right now. One tracks the tape. One tracks credit pressure.
Here’s the chart:
Let's break down what the chart shows:
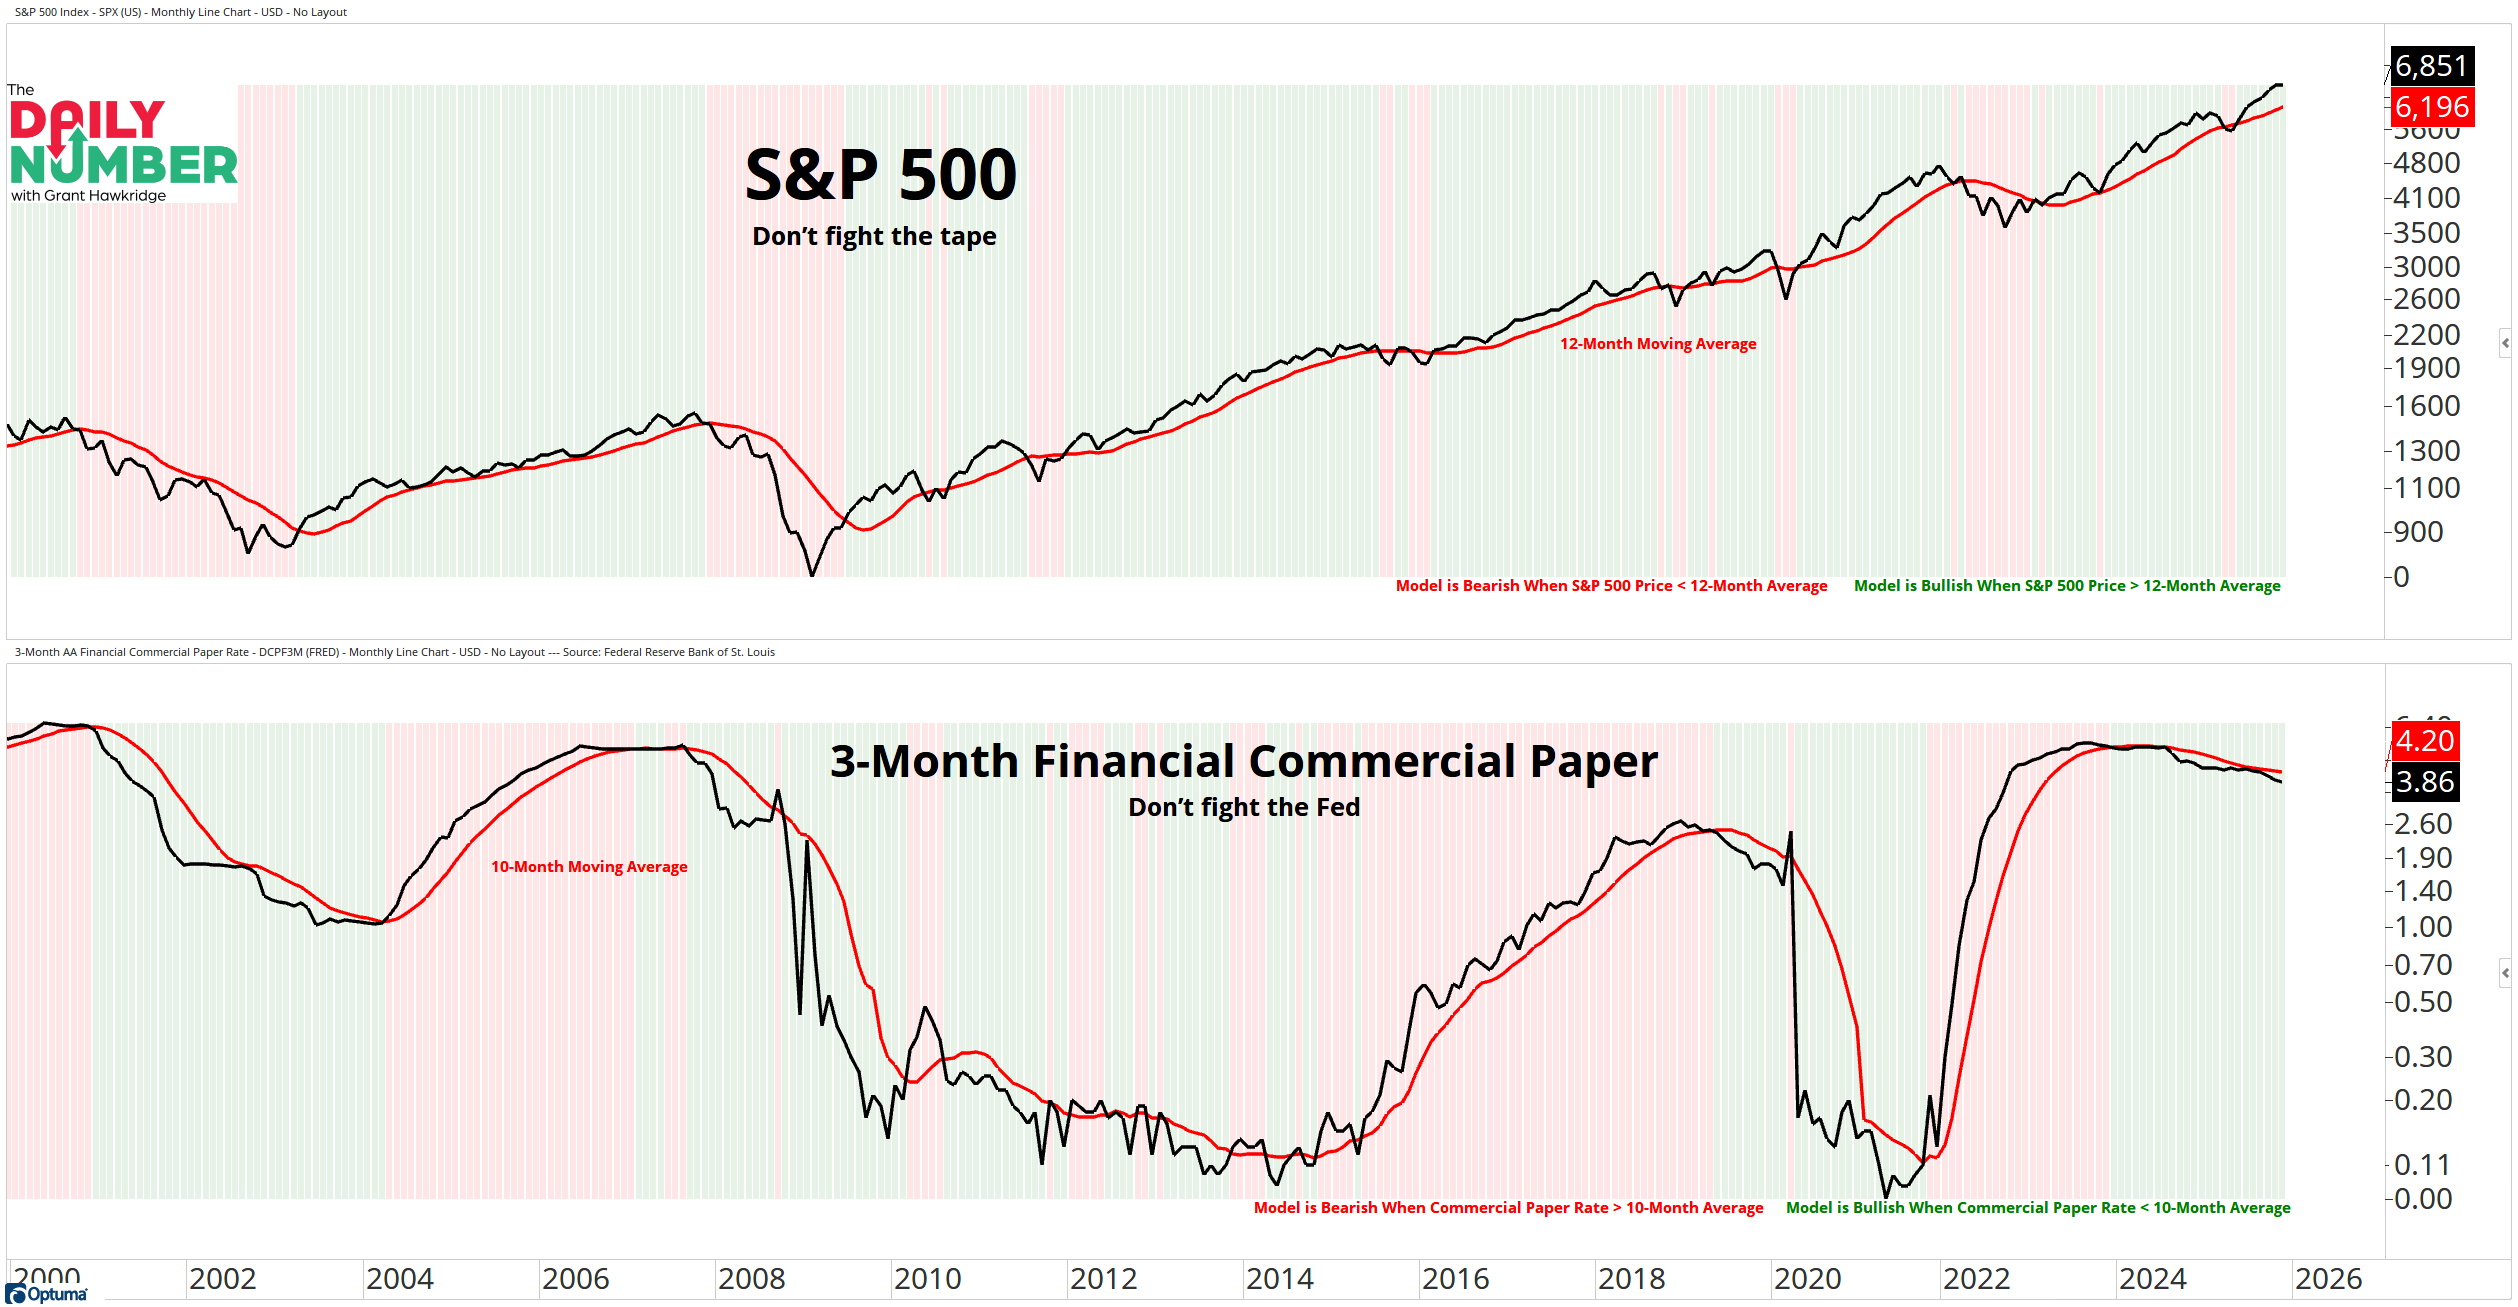
The top panel shows the S&P 500 as a black line and its 12-month moving average as a red line. The background shifts between green and red based on whether the index sits above or below that moving average.
The bottom panel shows the 3-month financial commercial paper rate as a black line and its 10-month moving average as a red line. The background also shifts between green and red based on whether the rate sits above or below that moving average.
The Takeaway: Two models lining up on green at the same time give a clear read on the market environment.
One tracks the trend through the S&P 500. The other tracks credit pressure through commercial paper.
When both lean the same way, you should take notice.
The tape model has held green for seven months. Price sits above the 12-month average, which tells us buyers still control the long-term trend.
The Fed model has stayed green for 24 months. Commercial paper sits below its 10-month average, which tells us stress is not rising.
Martin Zweig kept his rules simple.
Do not fight the tape.
Do not fight the Fed.
He leaned on the tape first because the price pays us. That idea still guides us today.
Trend leads. Macro follows.
And right now both models agree.
Until one of them changes, the bull market gets the benefit of the doubt.
If you find my content valuable, I would greatly appreciate it if you could share it with your friends, family, and colleagues. Your help in spreading the word is invaluable in supporting our work. Thank you to all of you who share!