If you missed it this week, I broke down this dashboard and how I actually use it in my process during my weekly show.
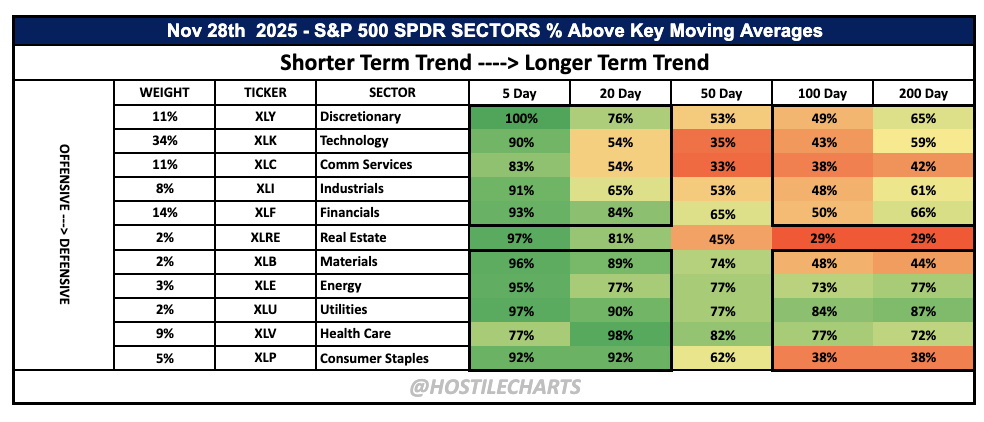
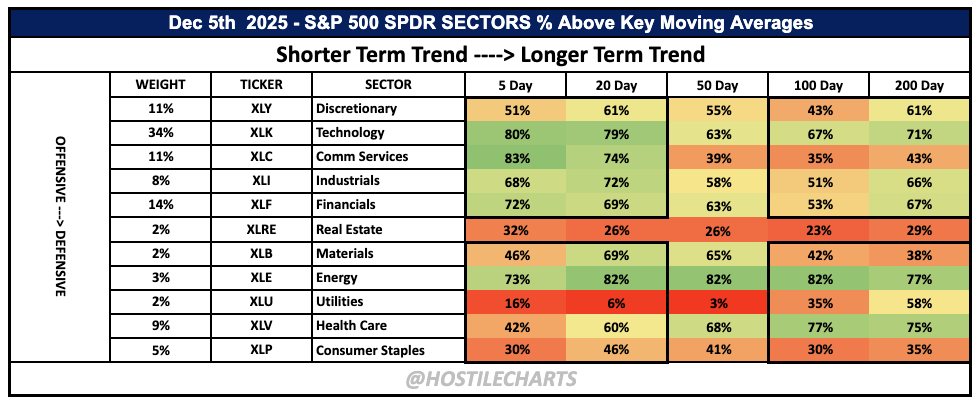
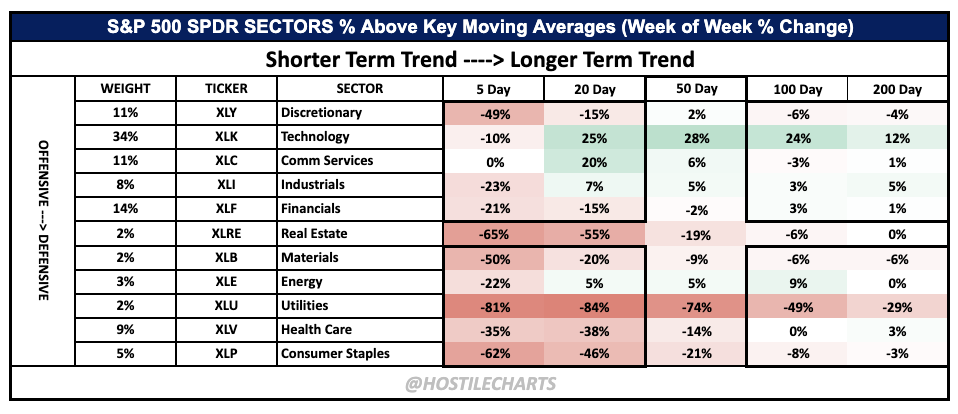
Breadth took a real breather this week short-term which makes sense after the surge we saw into Nov 28. The more interesting takeaway is that several offensive areas actually strengthened in their intermediate and longer-term trends. That’s the kind of quiet structural improvement you want to see in a market digesting gains rather than one breaking down.
The Stalk List
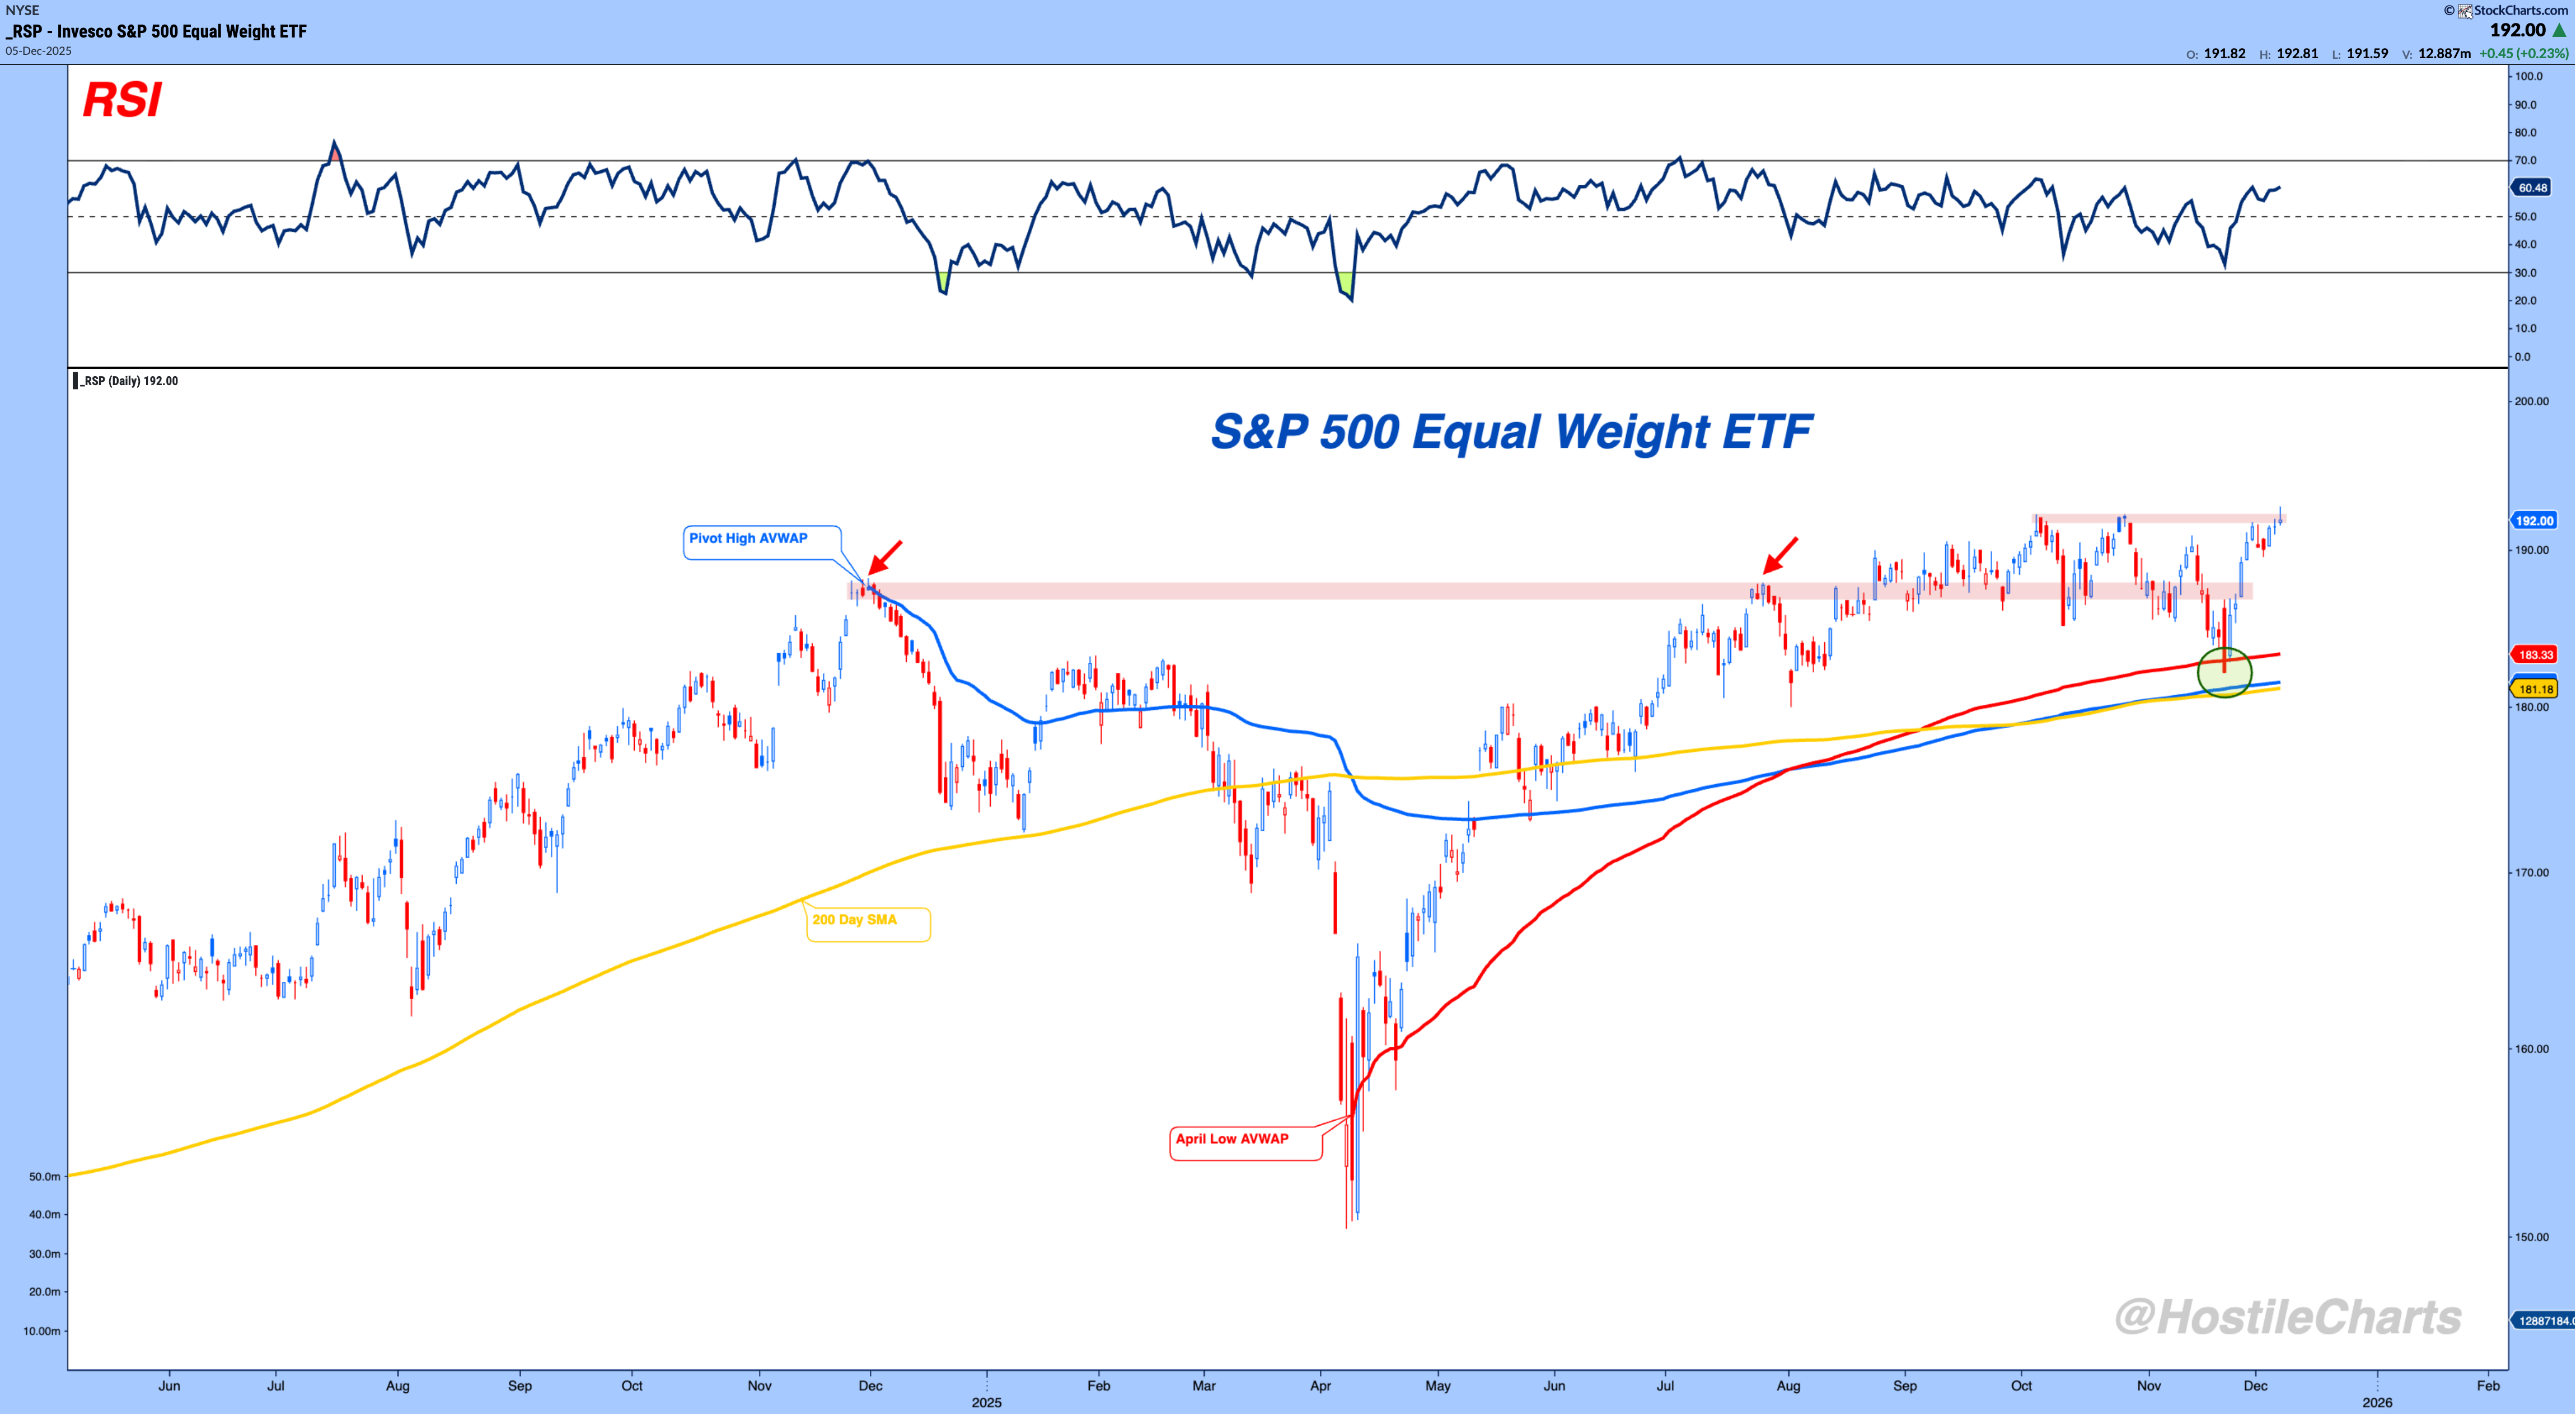
$RSP - S&P 500 Equal Weight ETF
RSP bounced sharply off the April AVWAP + 200-day cluster textbook logical support.
Now it’s slamming back into the 192 resistance shelf, and remember: equal-weight gives us a vote from the average S&P 500 stock.
A breakout here would signal broad participation; a rejection keeps the market stuck in a range.
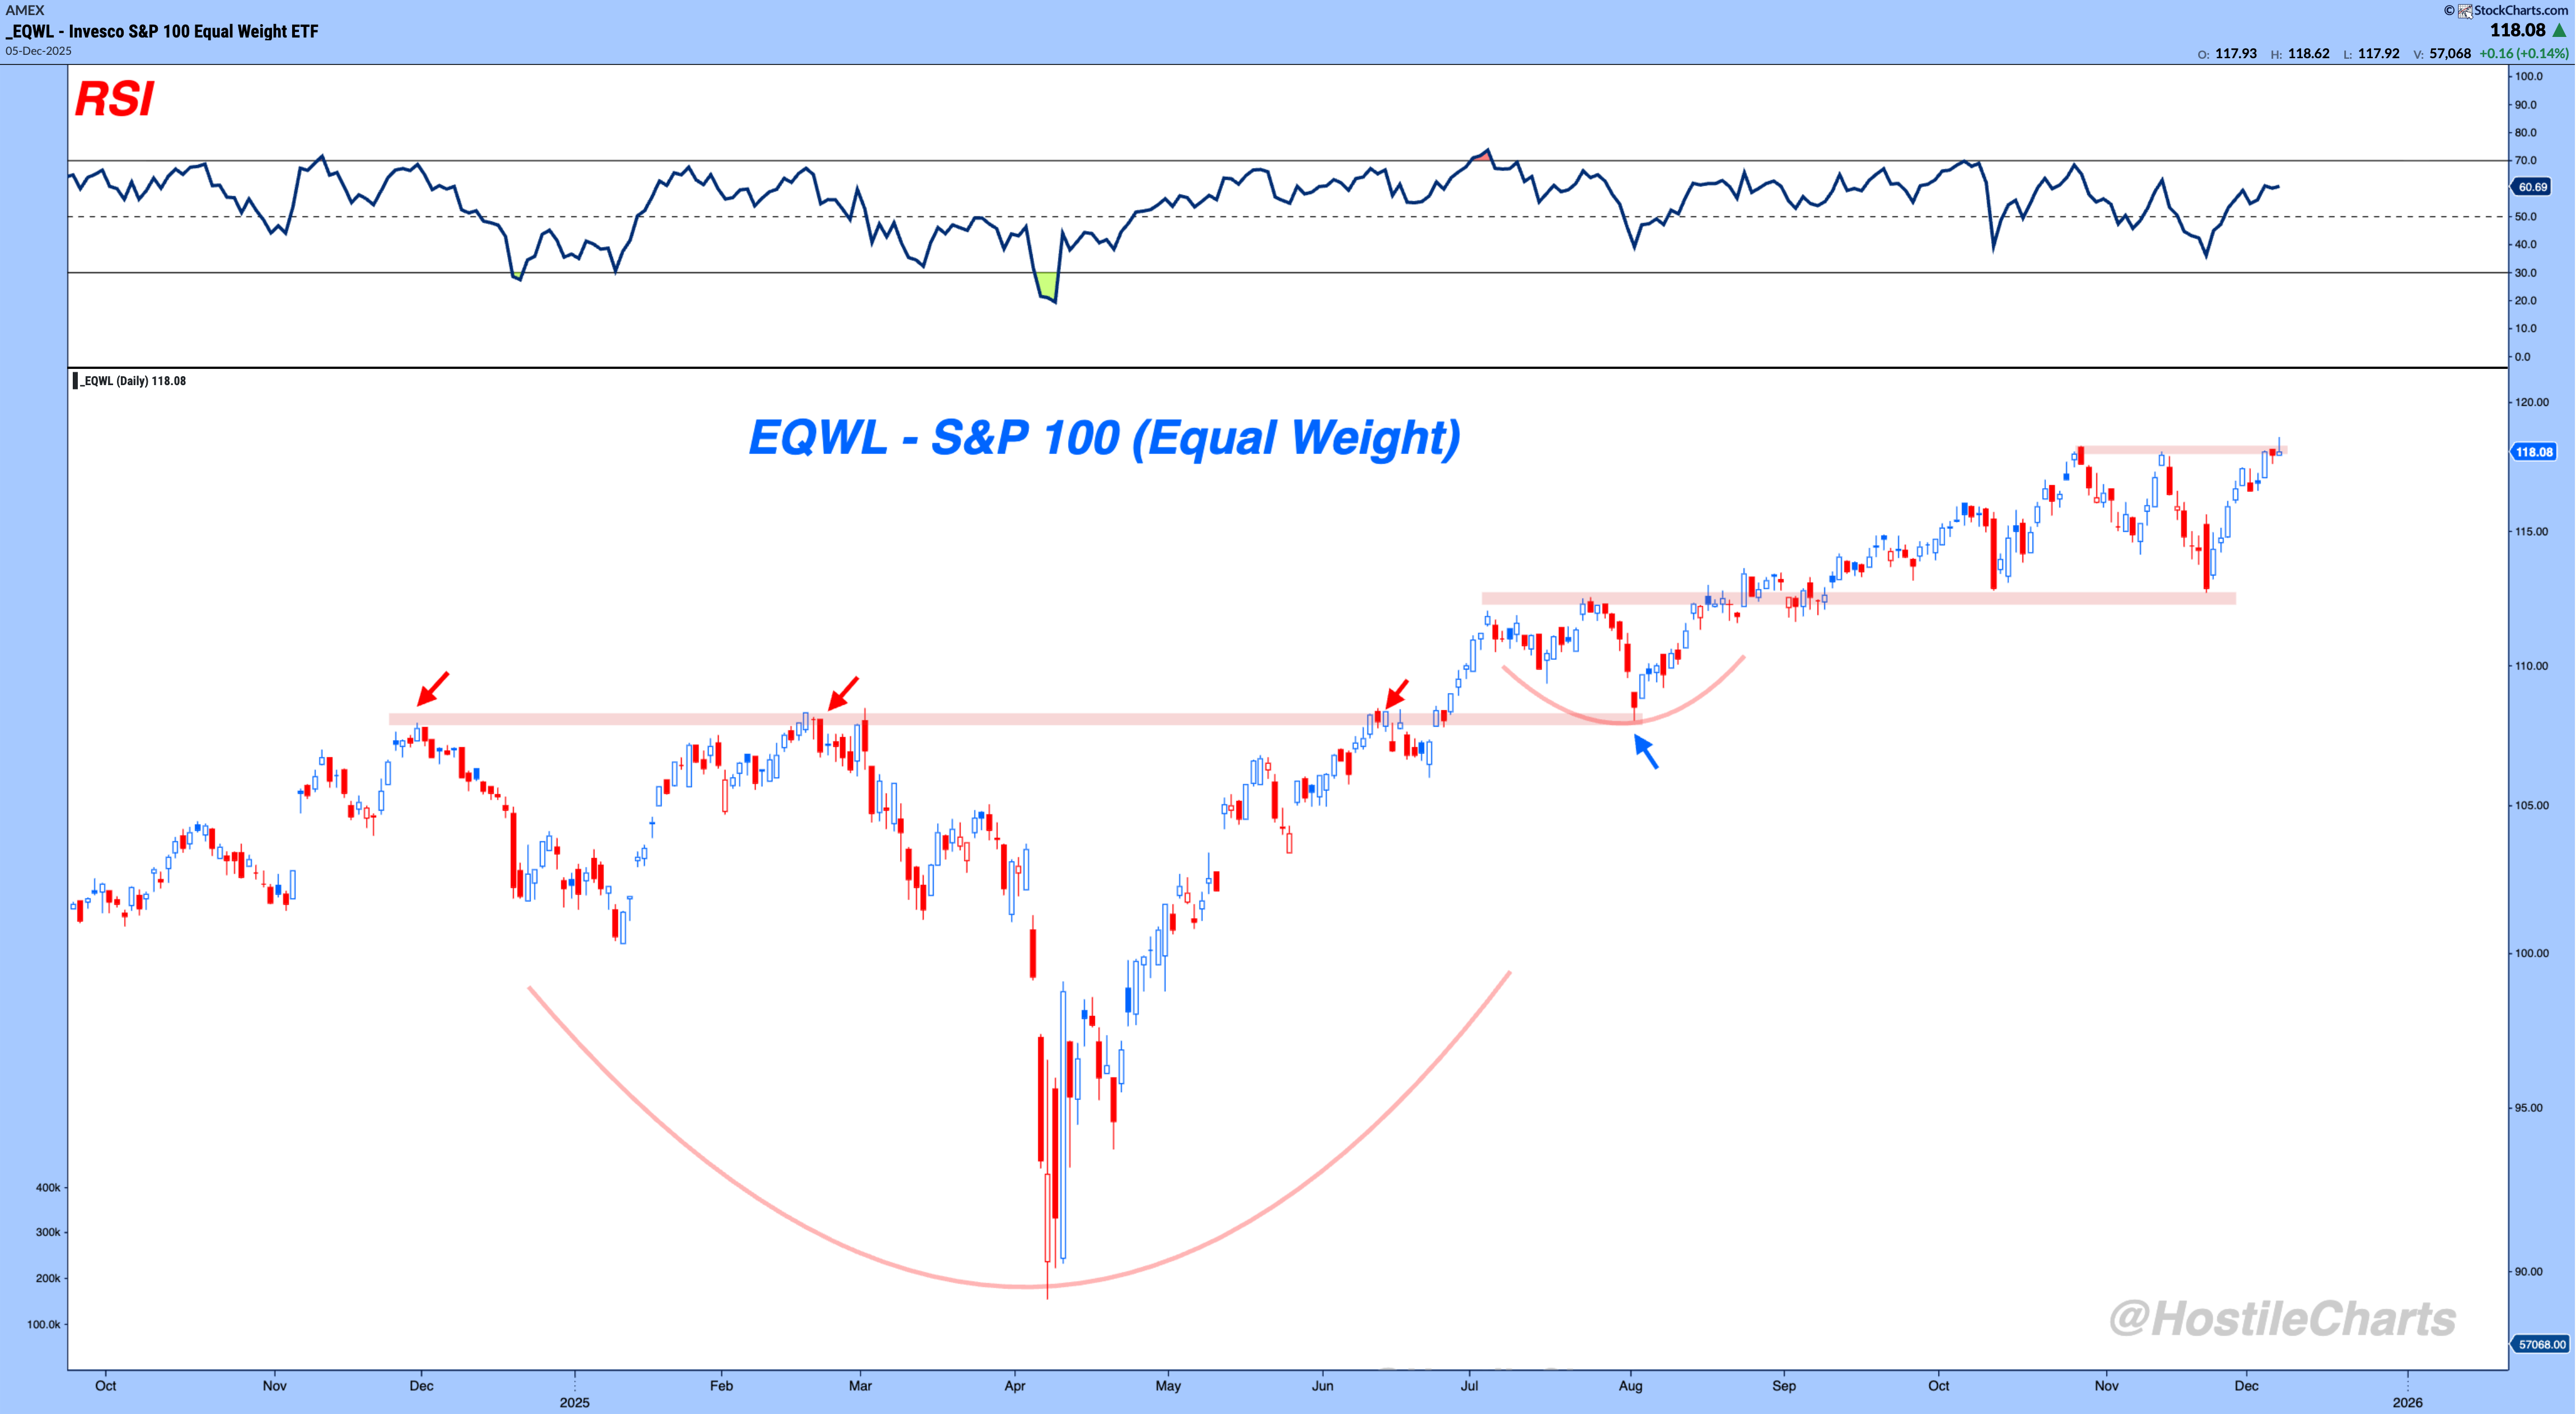
$EQWL - S&P 100 Equal Weight
EQWL put in a clean higher-low off the summer base and ripped right back to the 118 highs.
As with all equal-weight products, this is a direct read on the average stock in the S&P 100, and it’s now voting at resistance.
Break 118 and the next leg opens up; fail here and the range expands.
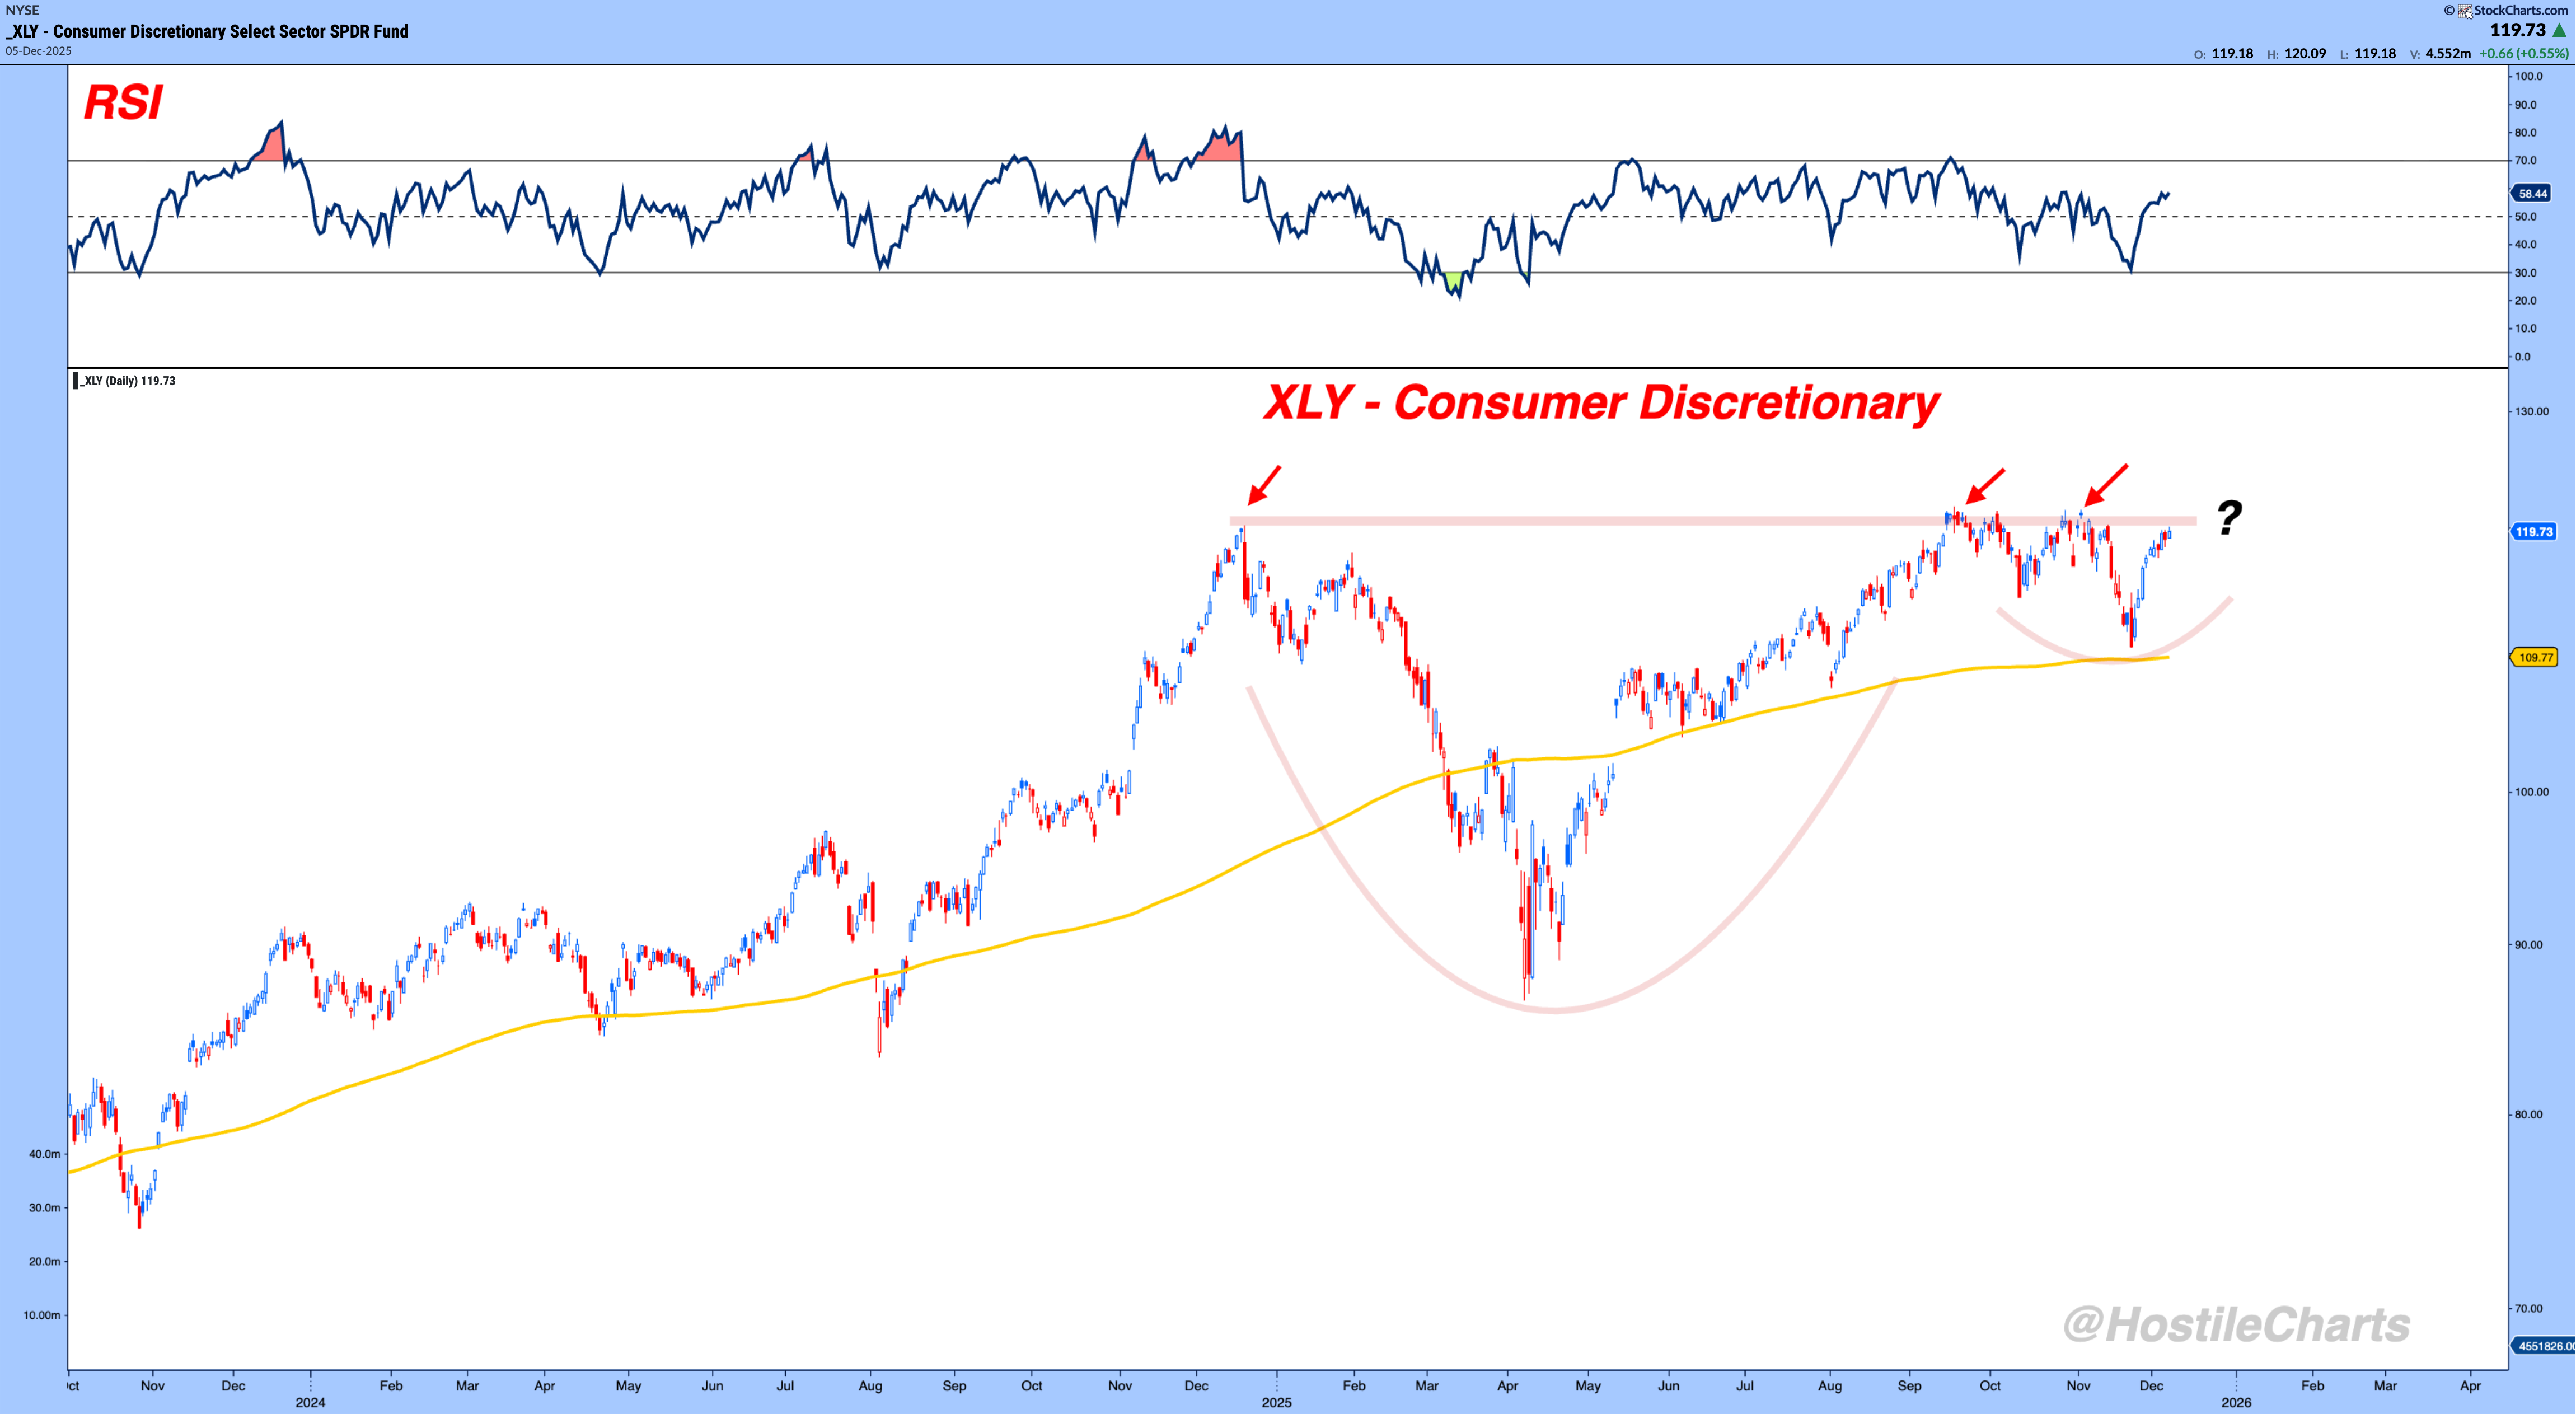
$XLY - Consumer Discretionary
Discretionary rallied right off the 200-day and the cup-and-handle base, exactly where buyers needed to show up.
Now it’s pressing into the familiar 120 ceiling that stopped price three separate times.
If buyers can finally punch through 120, the whole pattern completes - but failure here keeps XLY stuck in the same frustrating range.
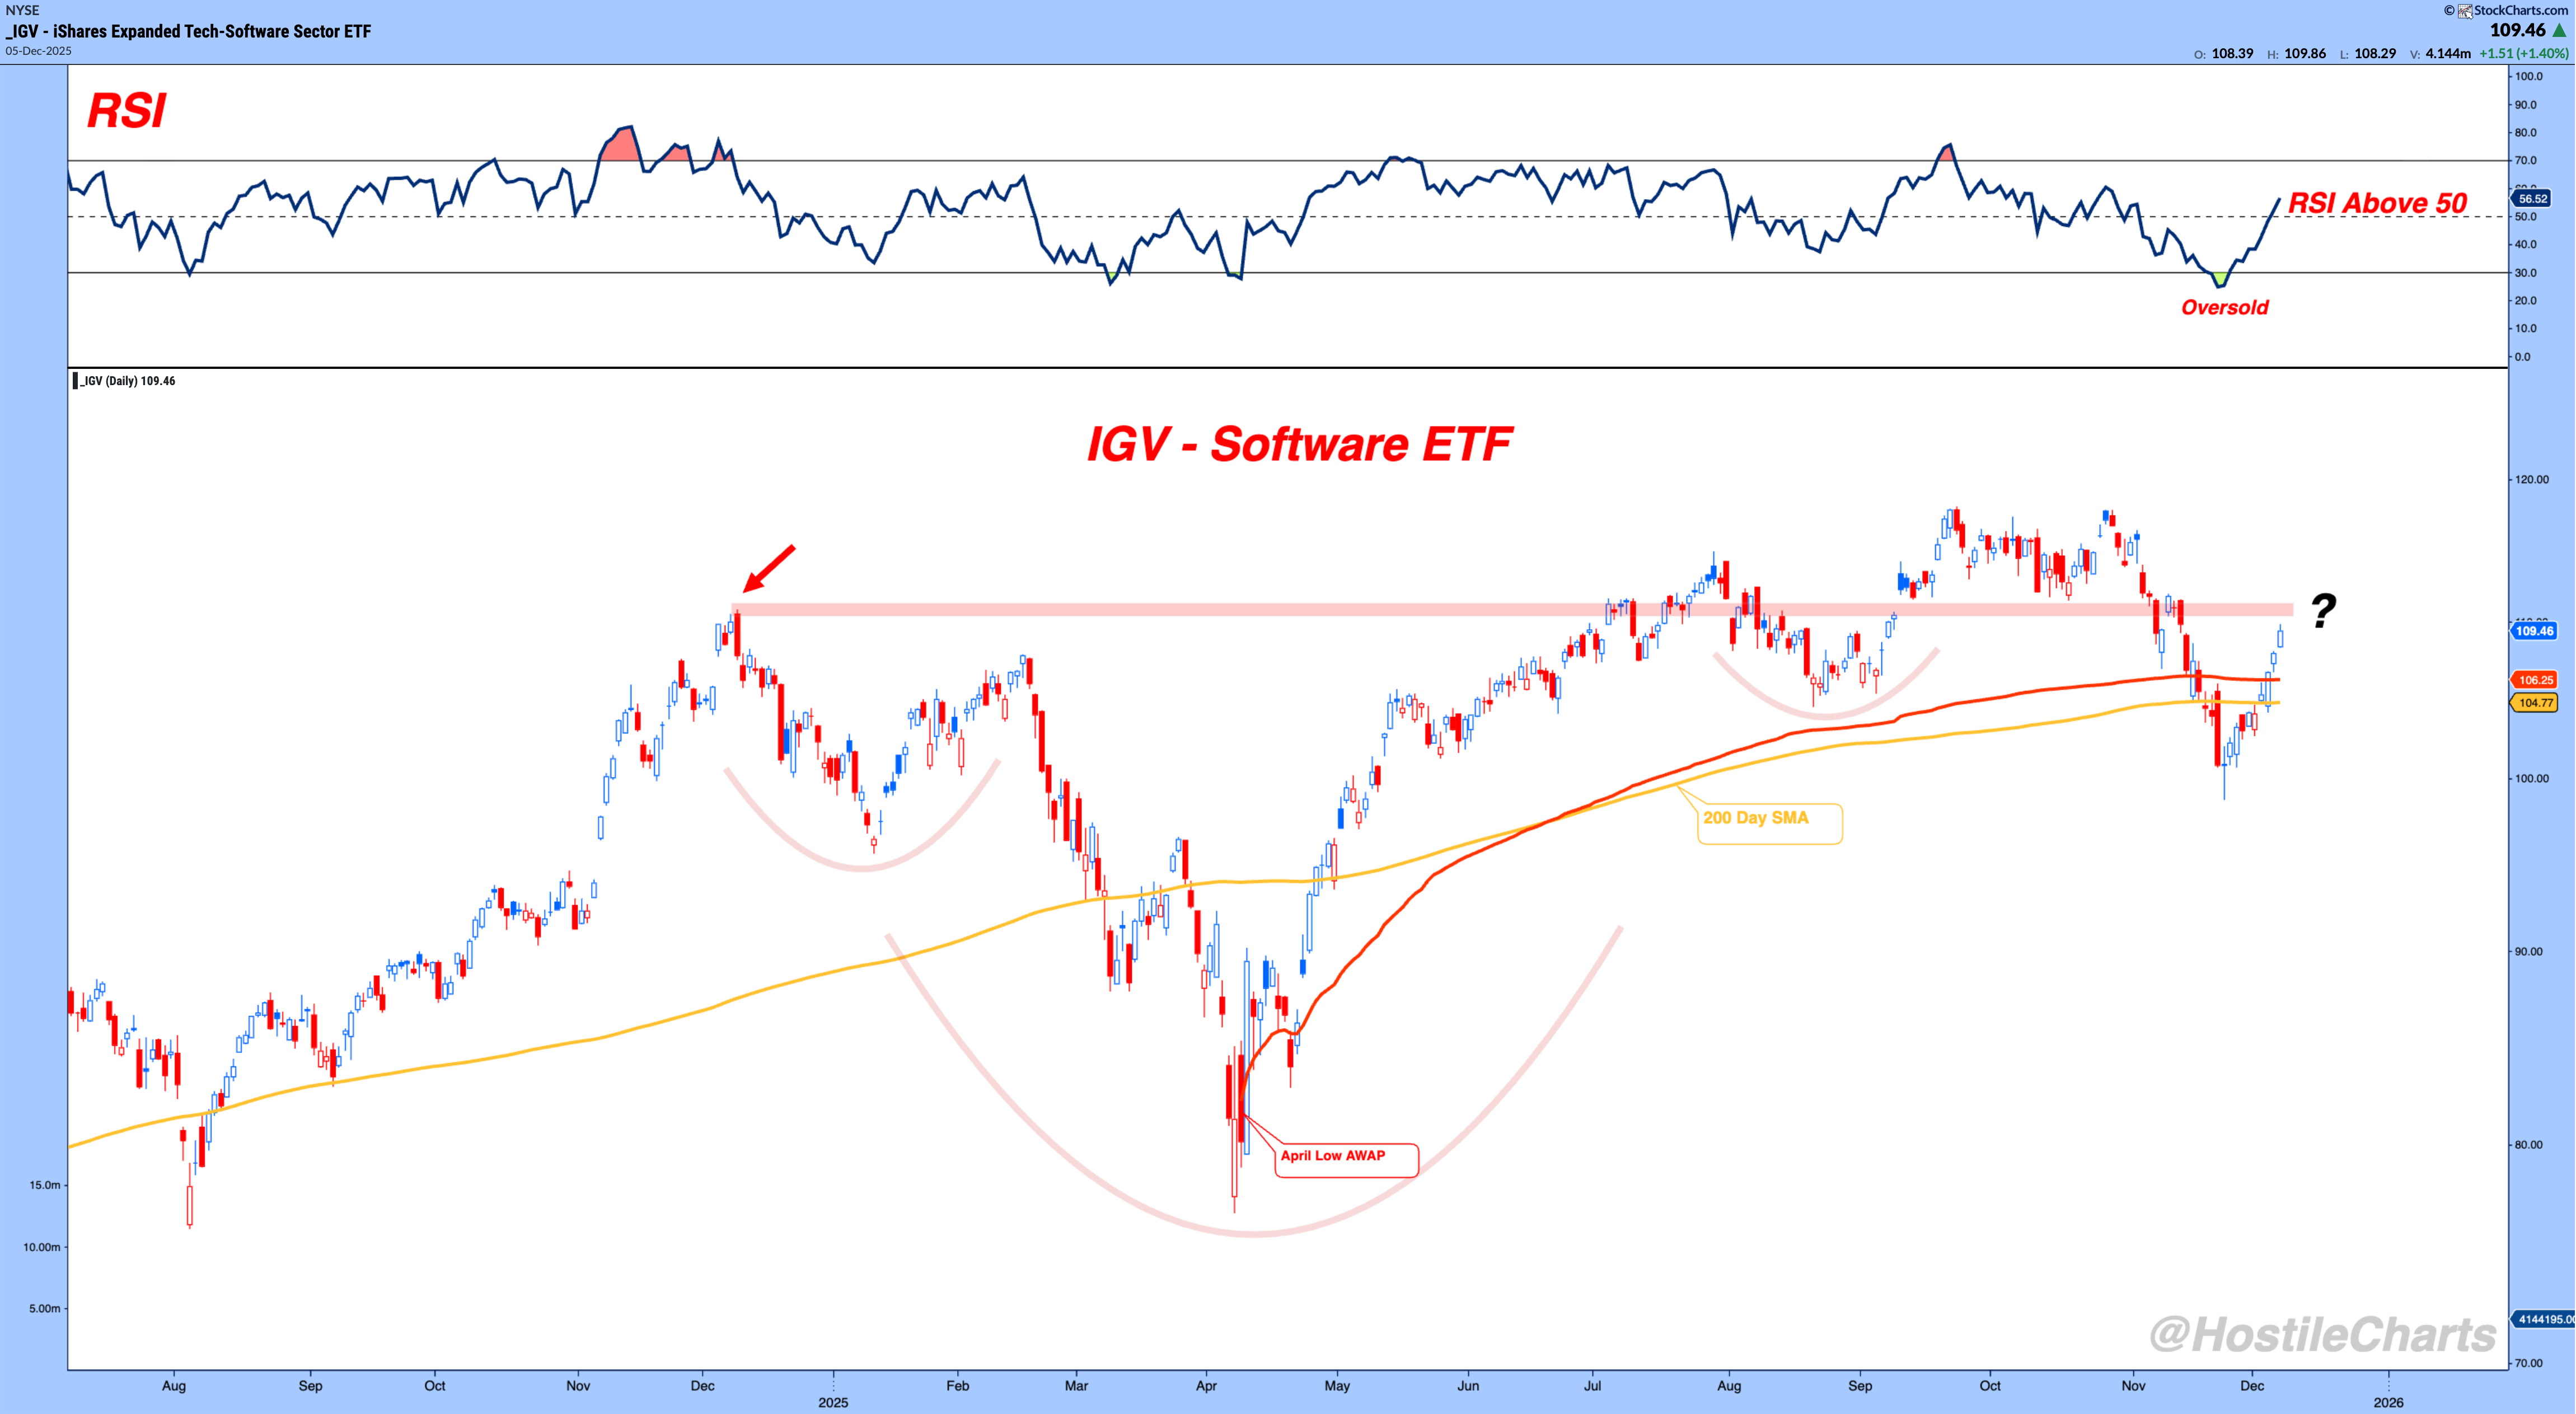
$IGV - Software ETF
Software held the April Low AVWAP and ripped straight off oversold conditions, reclaiming its major moving averages.
The hurdle now is the 110–112 supply zone that has repeatedly sent sellers into the tape.
Clear that shelf and IGV can finally transition from repair → leadership; fail there and it’s just another bounce into resistance.
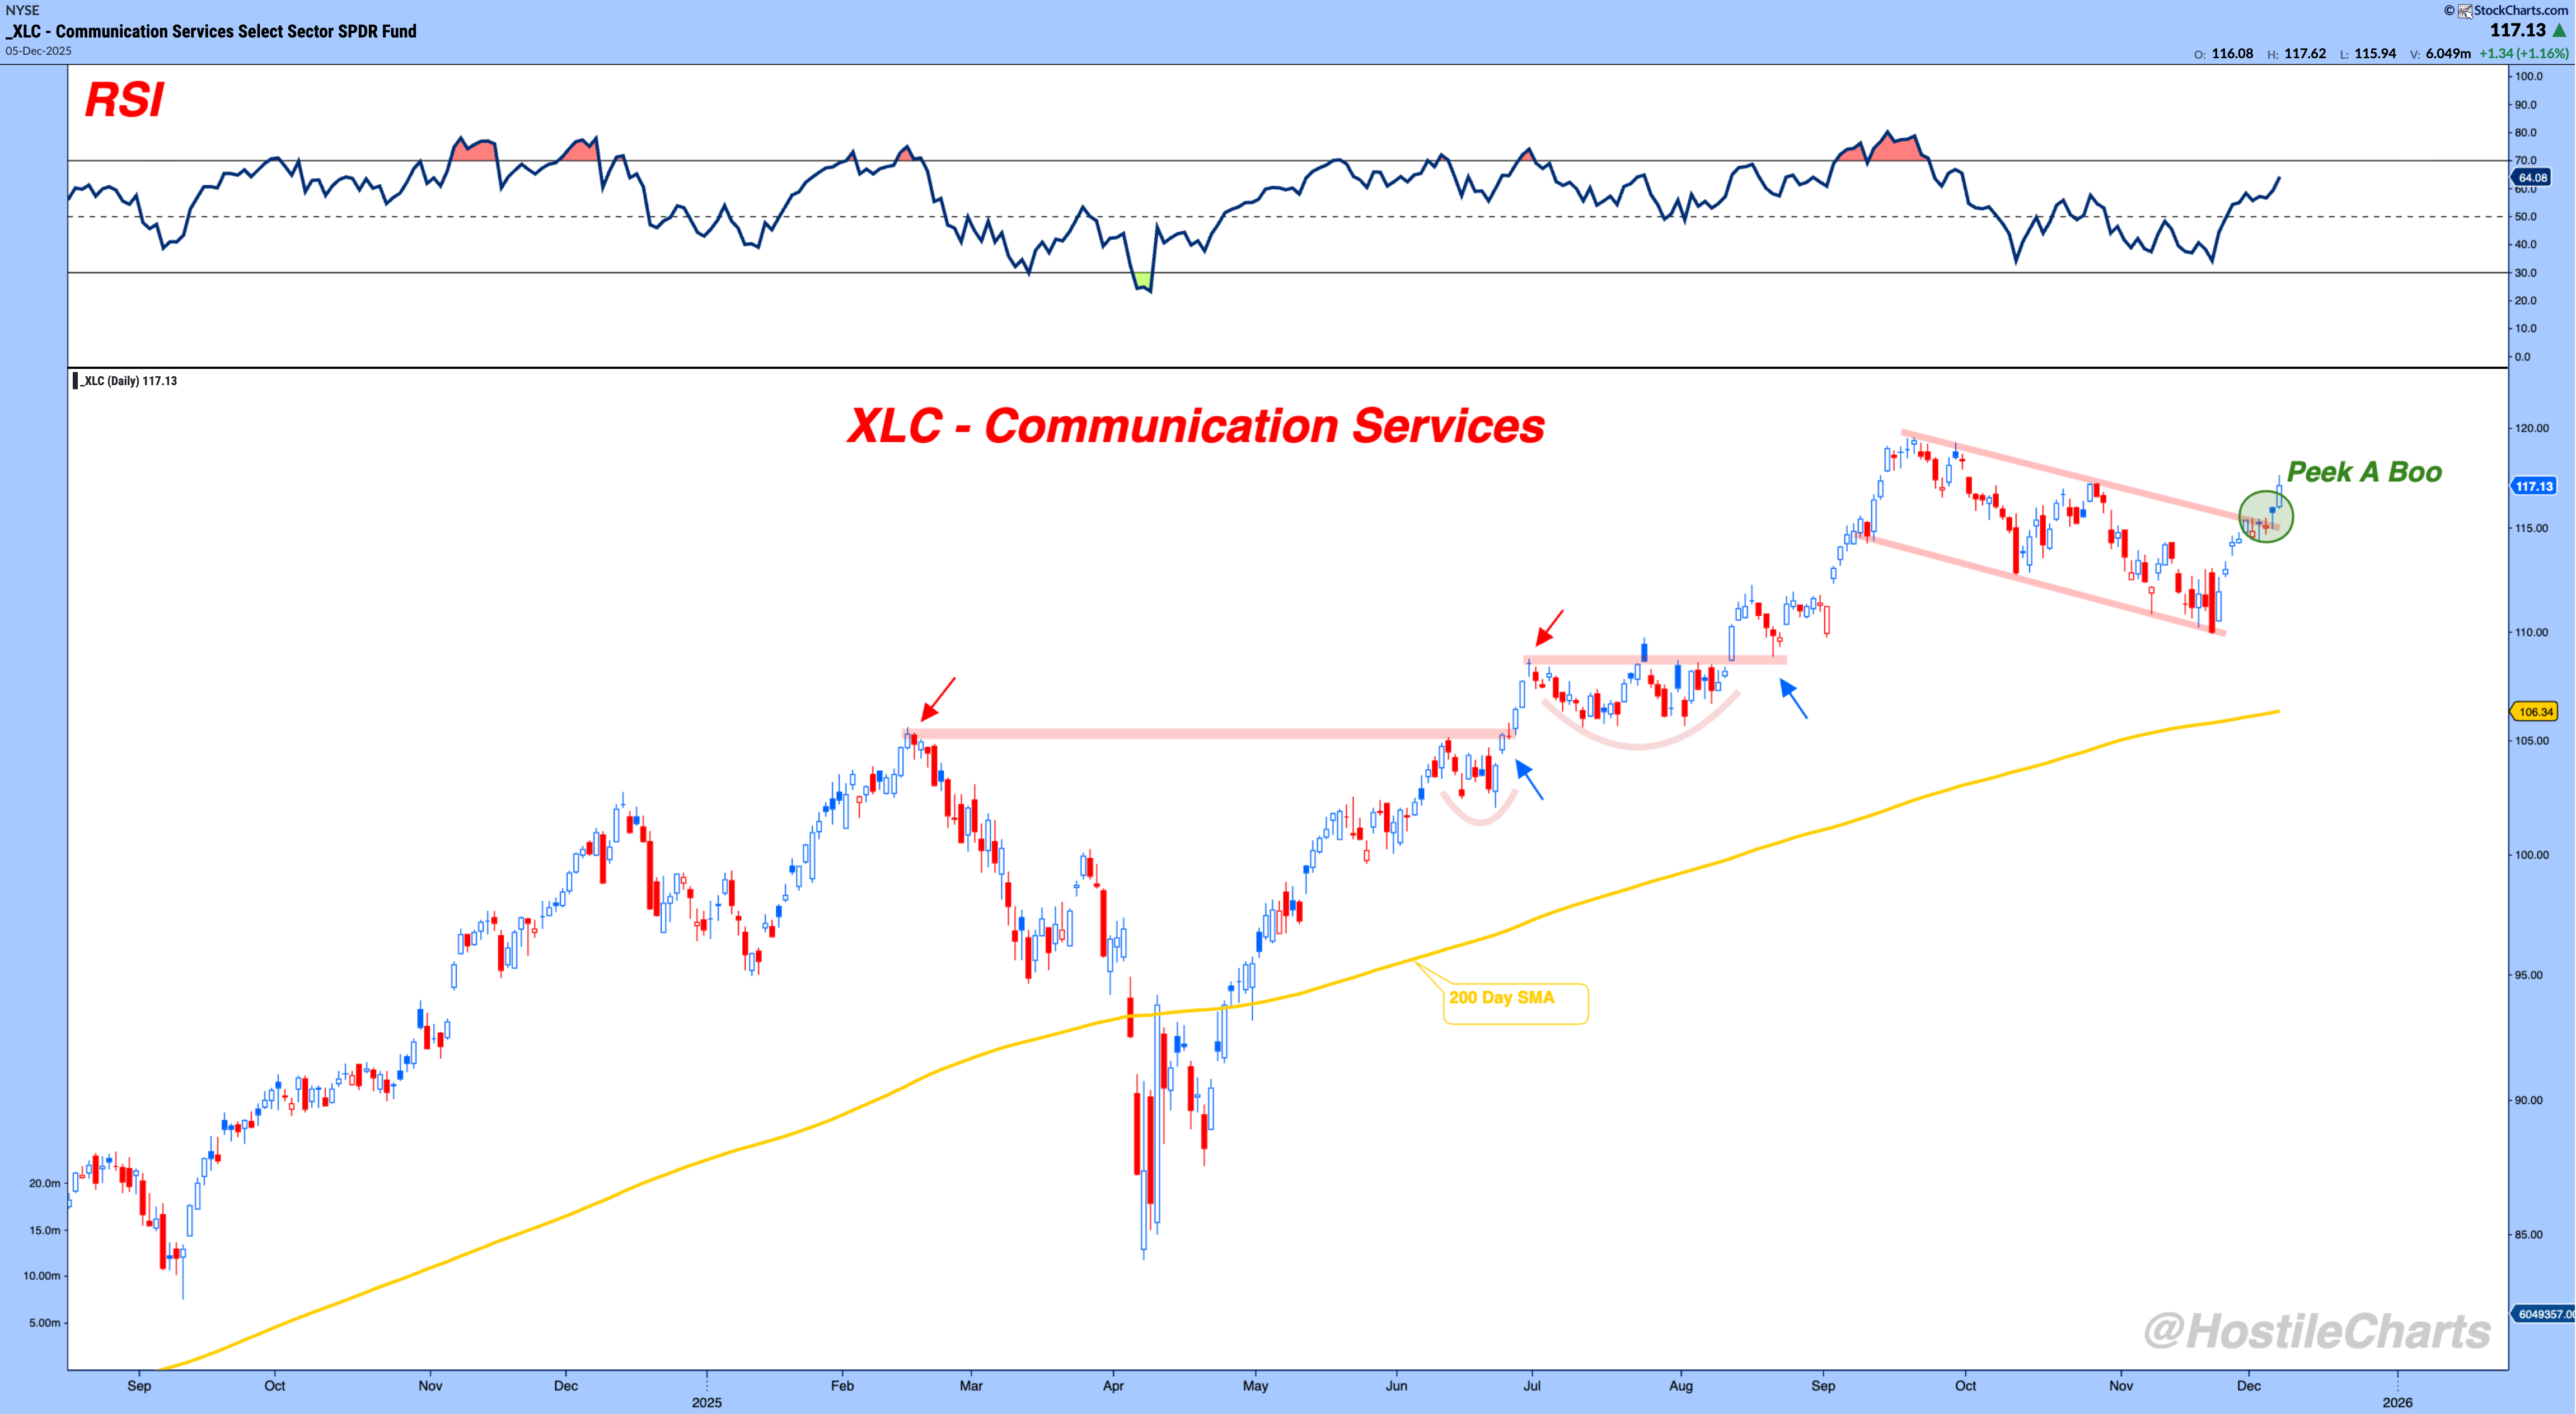
$XLC - Communication Services
XLC caught buyers right at channel support and pushed a “peek-a-boo” above the falling channel.
But now it’s pressing into the 117–118 zone that’s acted as consistent overhead supply.
Hold above 115 and keep pressing, but failure here just reasserts the down-channel structure.
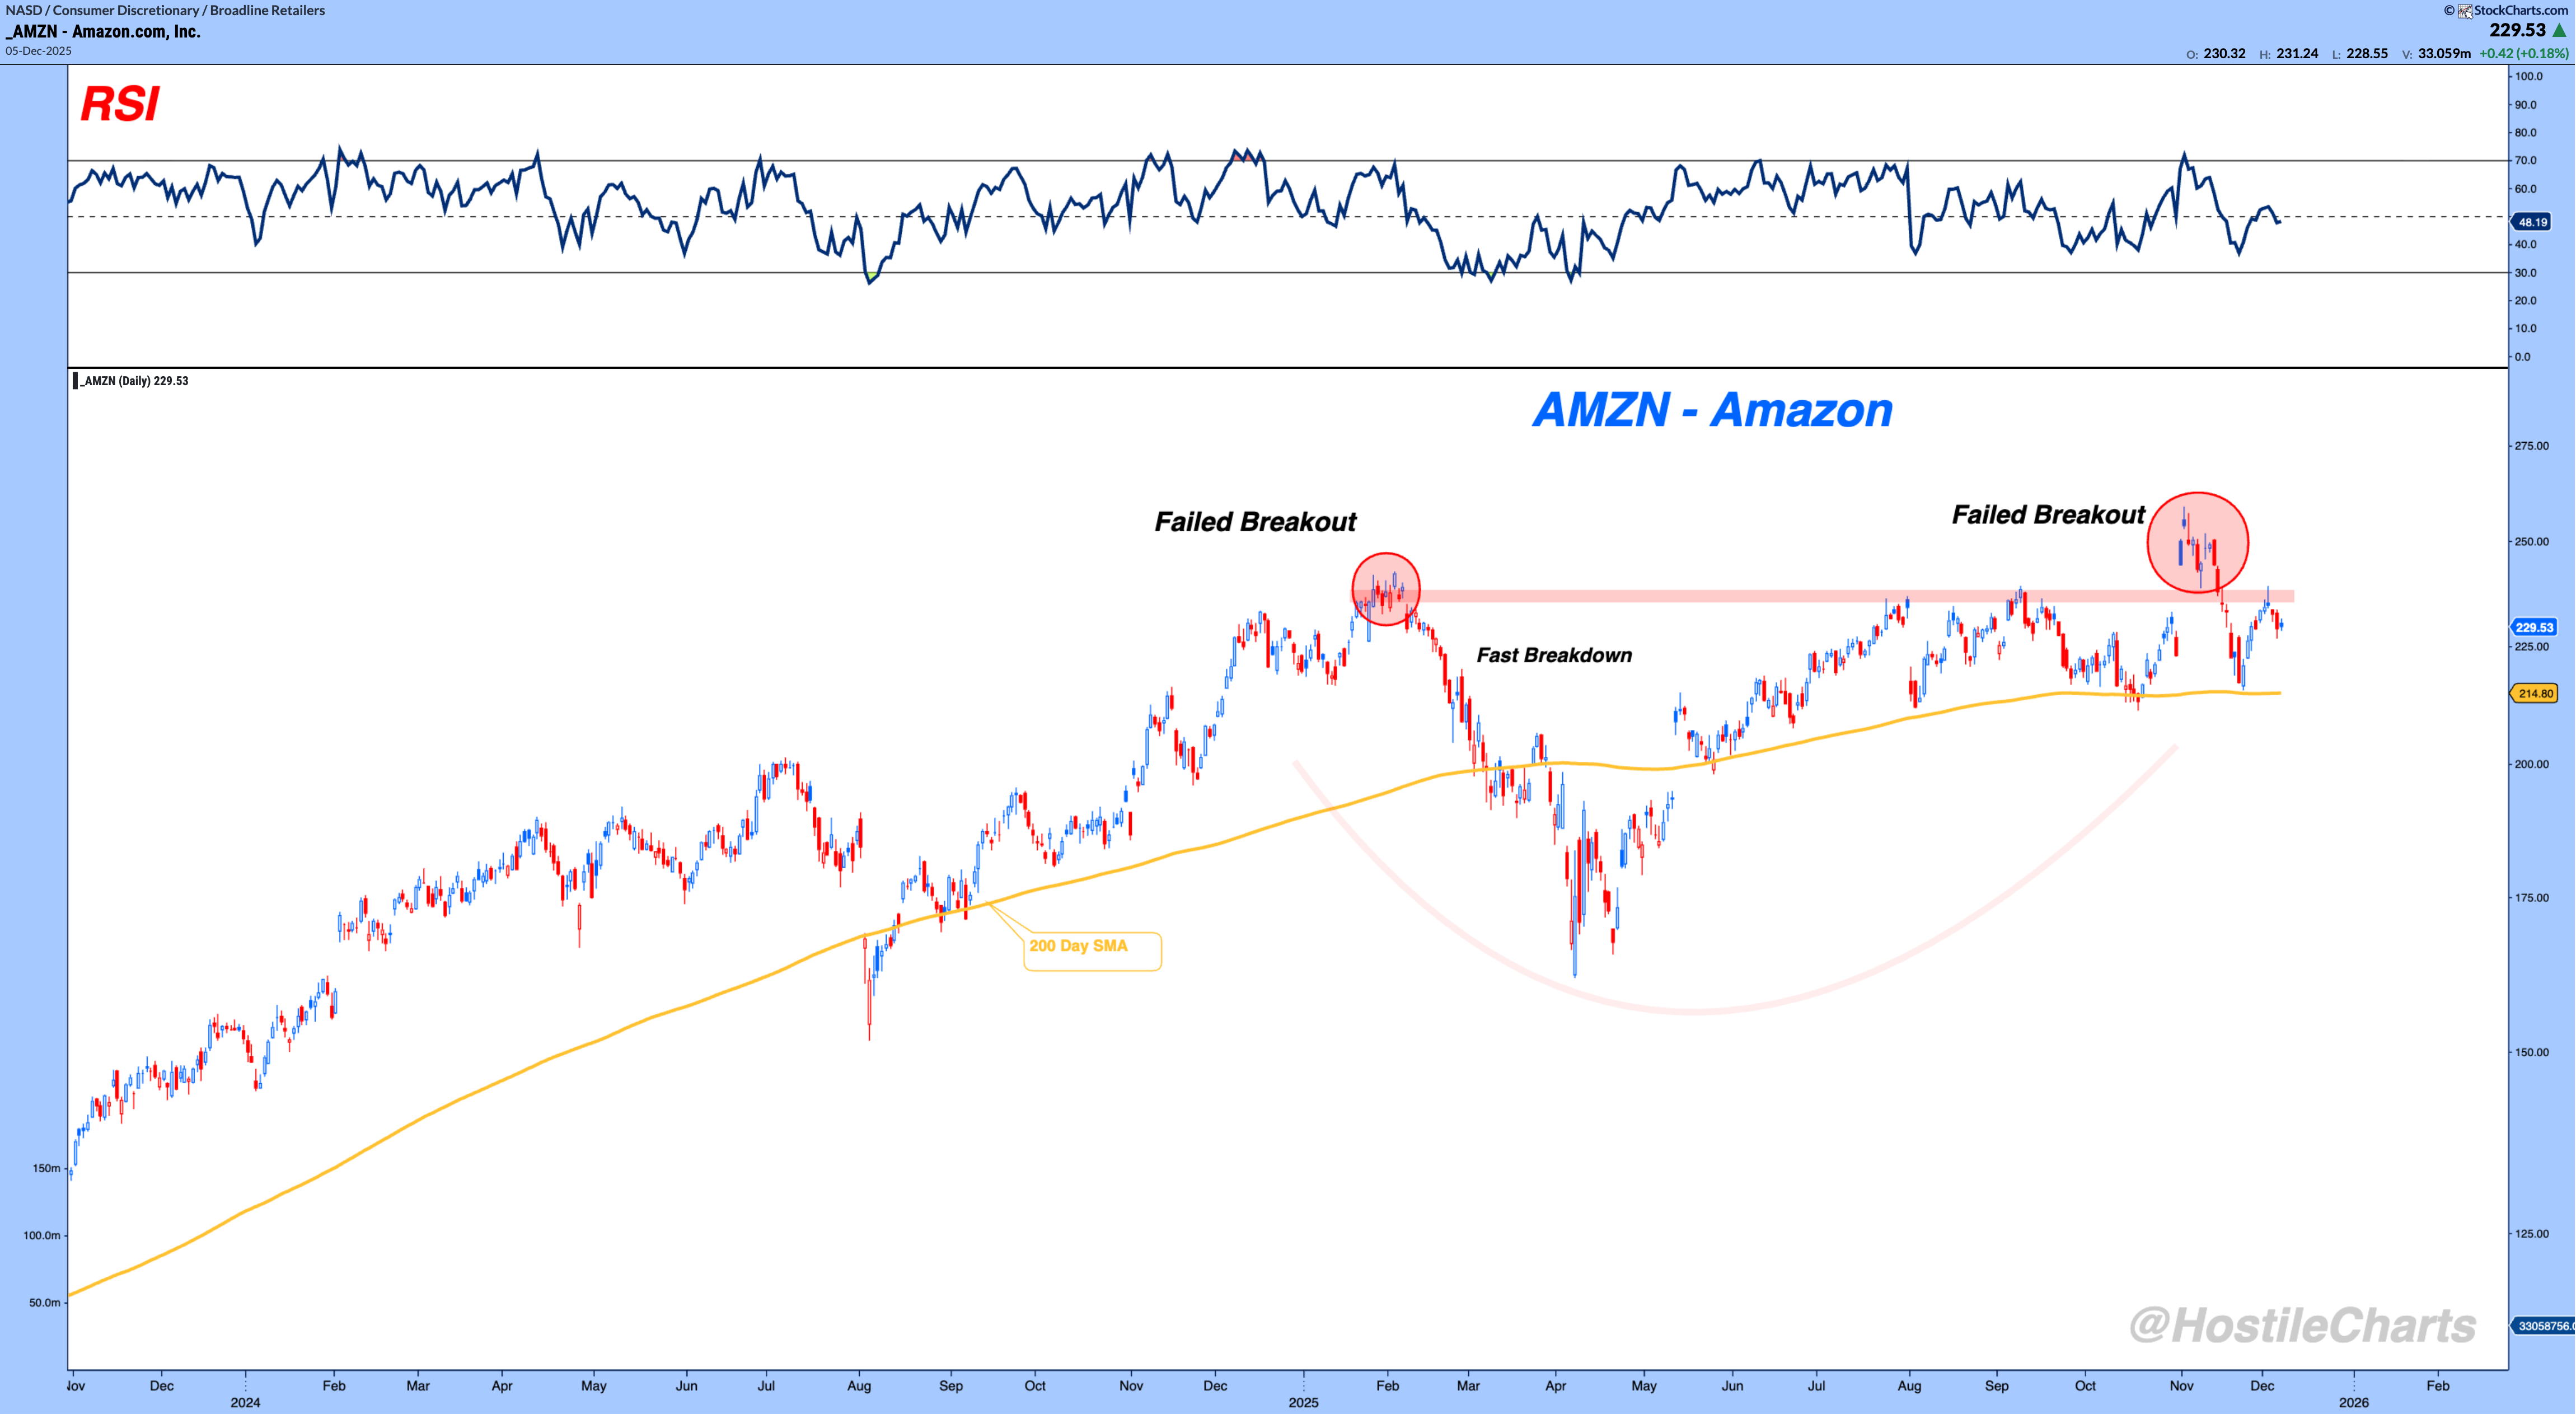
$AMZN - Amazon
Amazon bounced off the 214–215 support zone after two failed breakouts left supply stacked overhead.
The setup is simple: reclaim the 245 resistance band and the entire character of this chart shifts.
Until then, it’s just another recovery rally running into the same wall.
My Two Cents
Markets don’t get graded on the bounce, they get graded on what happens after the bounce.
We’re back at the levels where supply has shown up all year, and this is where trends either graduate or get sent back to study hall.
If buyers can finally punch through these shelves, the character of this tape changes fast.
If not, we stay in the same range-bound environment that’s chopped up impatient traders for months.