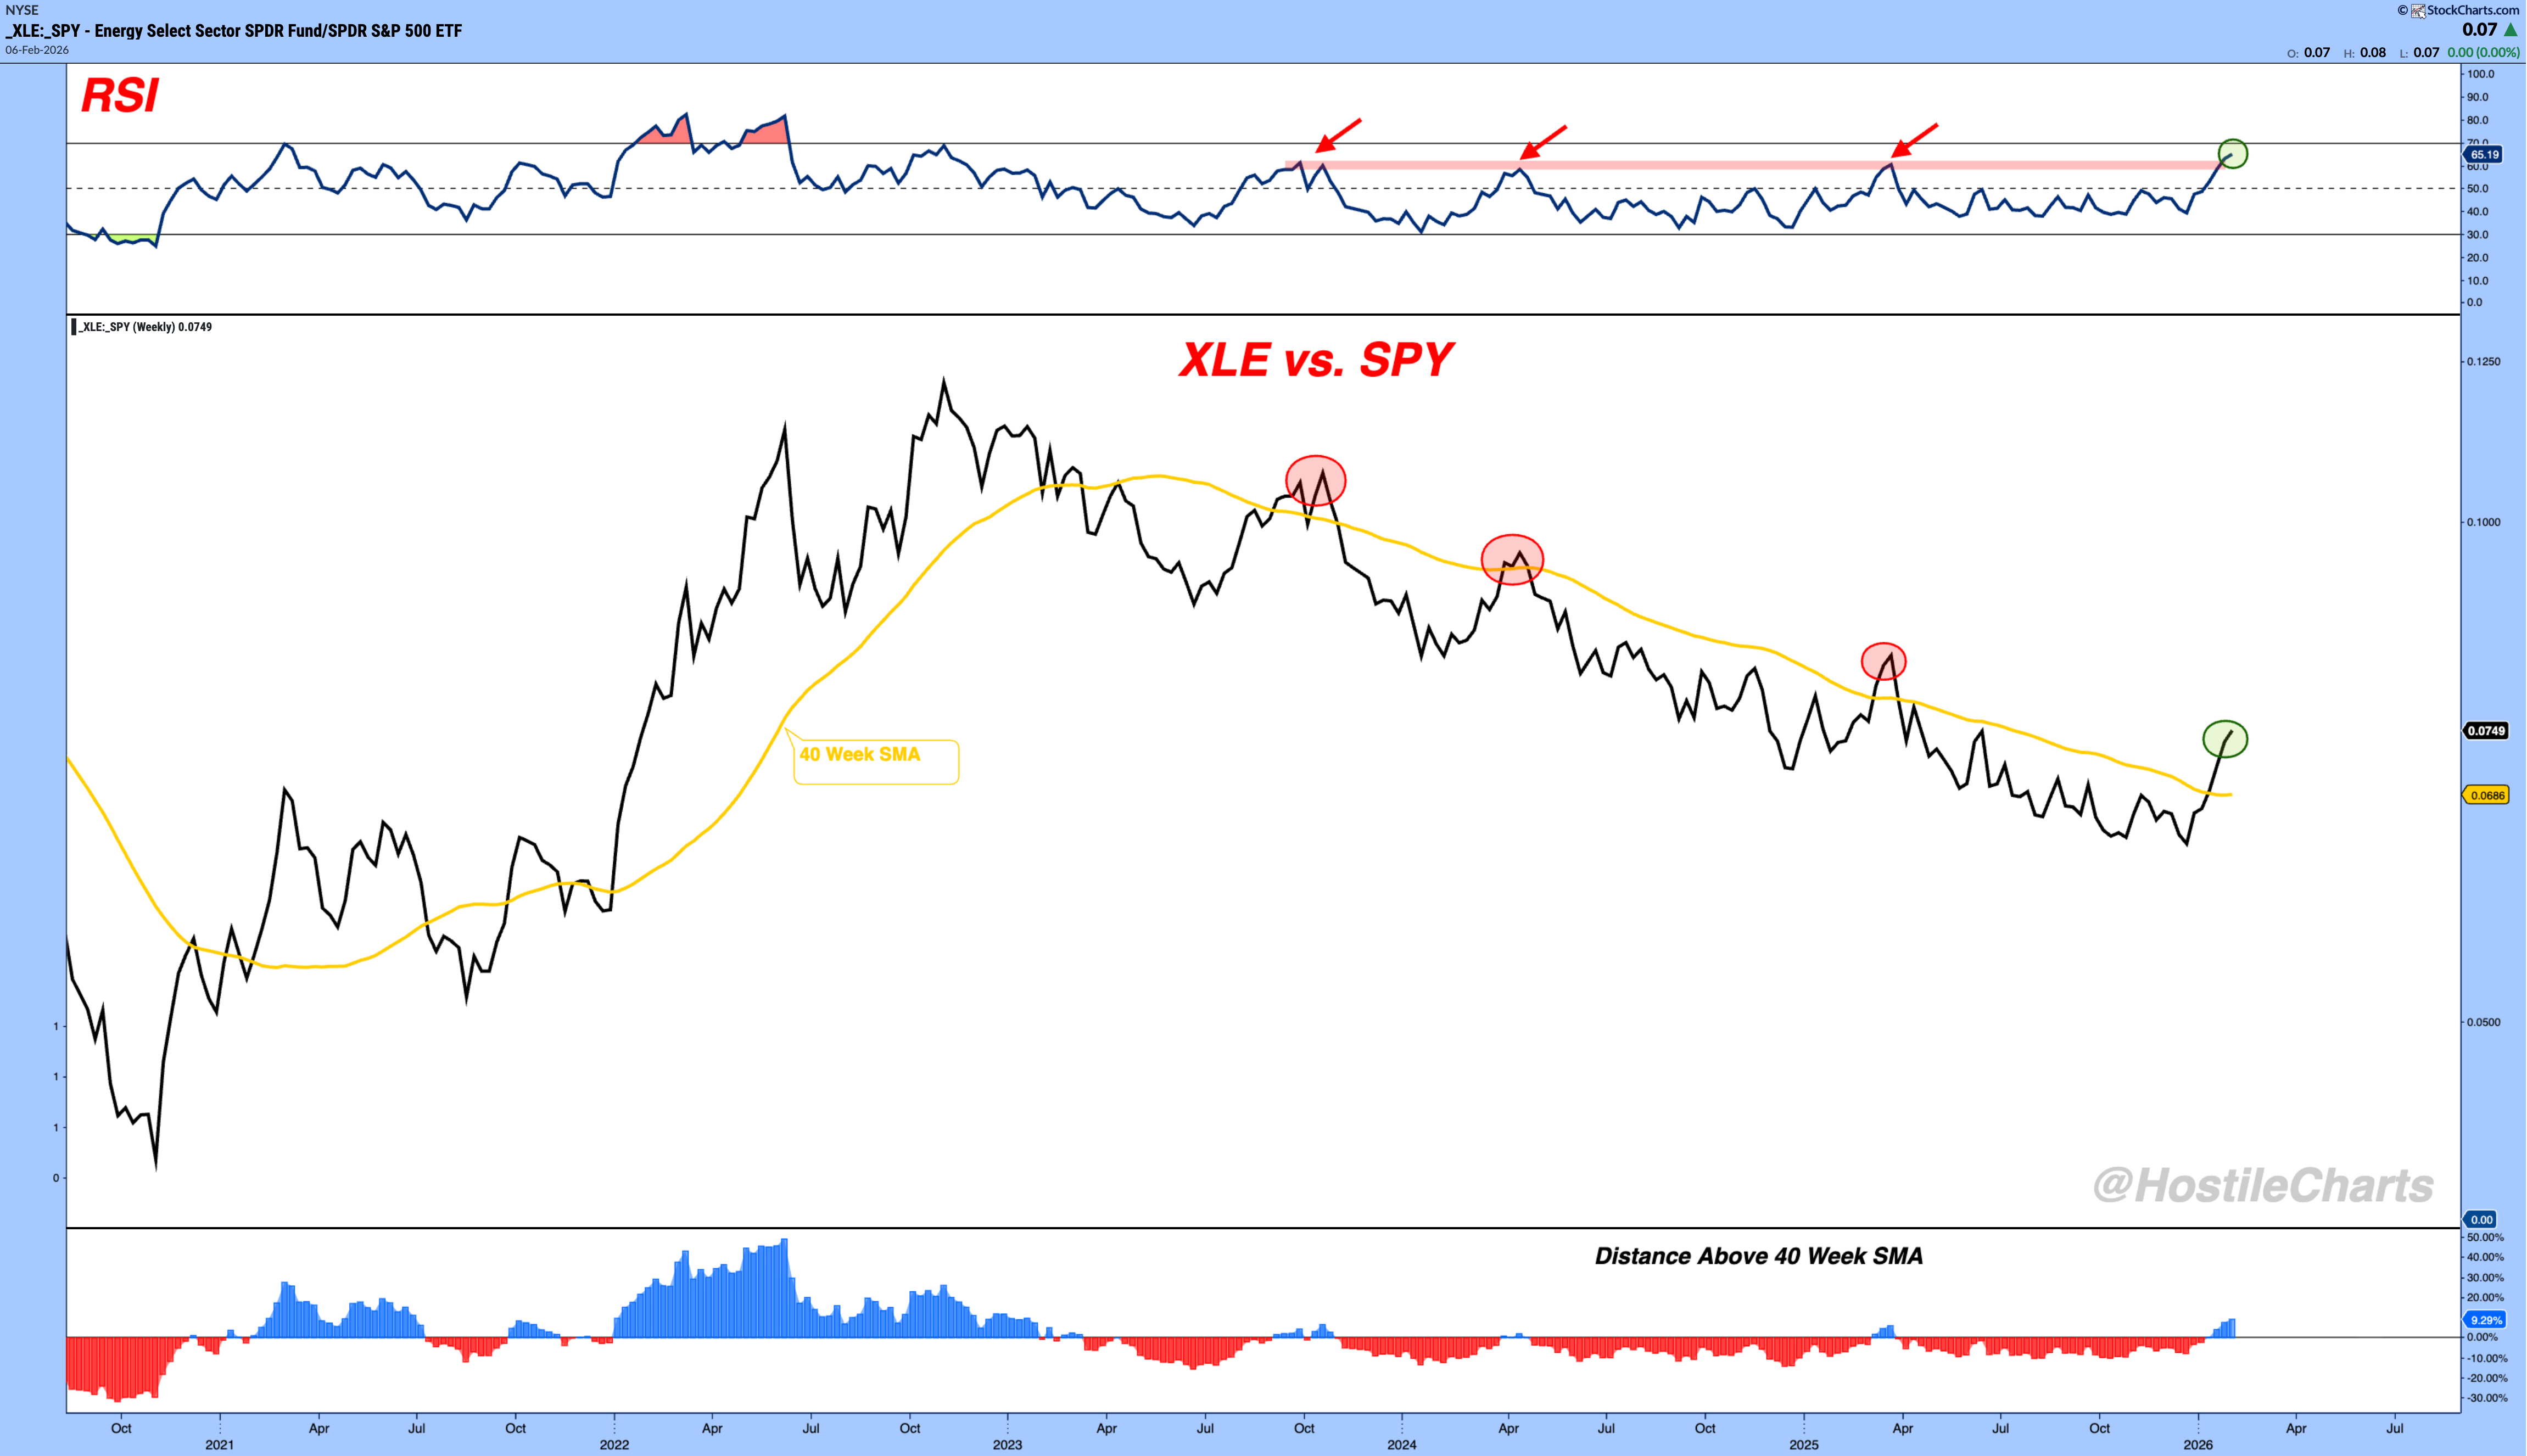
Energy Stocks Look Different This Time This One Chart Explains It All By Larry Thompson February 3, 2026 I’ve written plenty of hate mail over the past three years as energy’s failed breakouts piled up.Hate Mail #1 and Hate Mail #2 and Hate Mail #3 are just a few of them. Because every rally looked promising and every one ran out of gas.But here’s what most people miss.Stocks don’t care if you’re tired of their failed breakouts, so neither should you.That one time you ignore the signal because it “fooled you before” might be the time it actually gets going.So keep executing the trades.Regardless of how you feel.Let’s break it down. First, relative trend.Yes, XLE vs. SPY has tried to turn higher before. That part isn’t new. What is new is that this time it’s actually pushing against the downtrend instead of immediately rolling over.Second, momentum.In downtrends, RSI rallies usually die around 60. That’s been the ceiling for years. This time, momentum is pushing through that level and holding. That’s a meaningful change in character.Third, long-term support.Price is above the 200-day moving average for the largest stretch we’ve seen in years. Even a pullback here would still leave room to buy, instead of forcing you to chase strength or puke weakness. Put those three together and this move looks different. Different enough I might have to write an apology. Anyway, that’s my two cents. Thompson's Two Cents Larry Thompson delivers timeless trading lessons and market wisdom in quick daily notes. More from Thompson's Two Cents Larry Thompson Following The Meatheads The Drugs Work.... June 16, 2026 Larry Thompson The Sunday Stalk List | Ep.46 Solving Problems May 31, 2026 Larry Thompson You Don't Own Enough Energy Fix It May 19, 2026 Trade Smarter With Larry’s TakeThompson’s Two Cents offers concise market wisdom, timeless trading lessons, and chart-driven perspective you can trust. You must have JavaScript enabled to use this form. Email More from Thompson's Two Cents Thompson's Two Cents Watch Now