100% of S&P 500 sectors have their 50-day moving average above their 200-day moving average.
Here’s the chart:
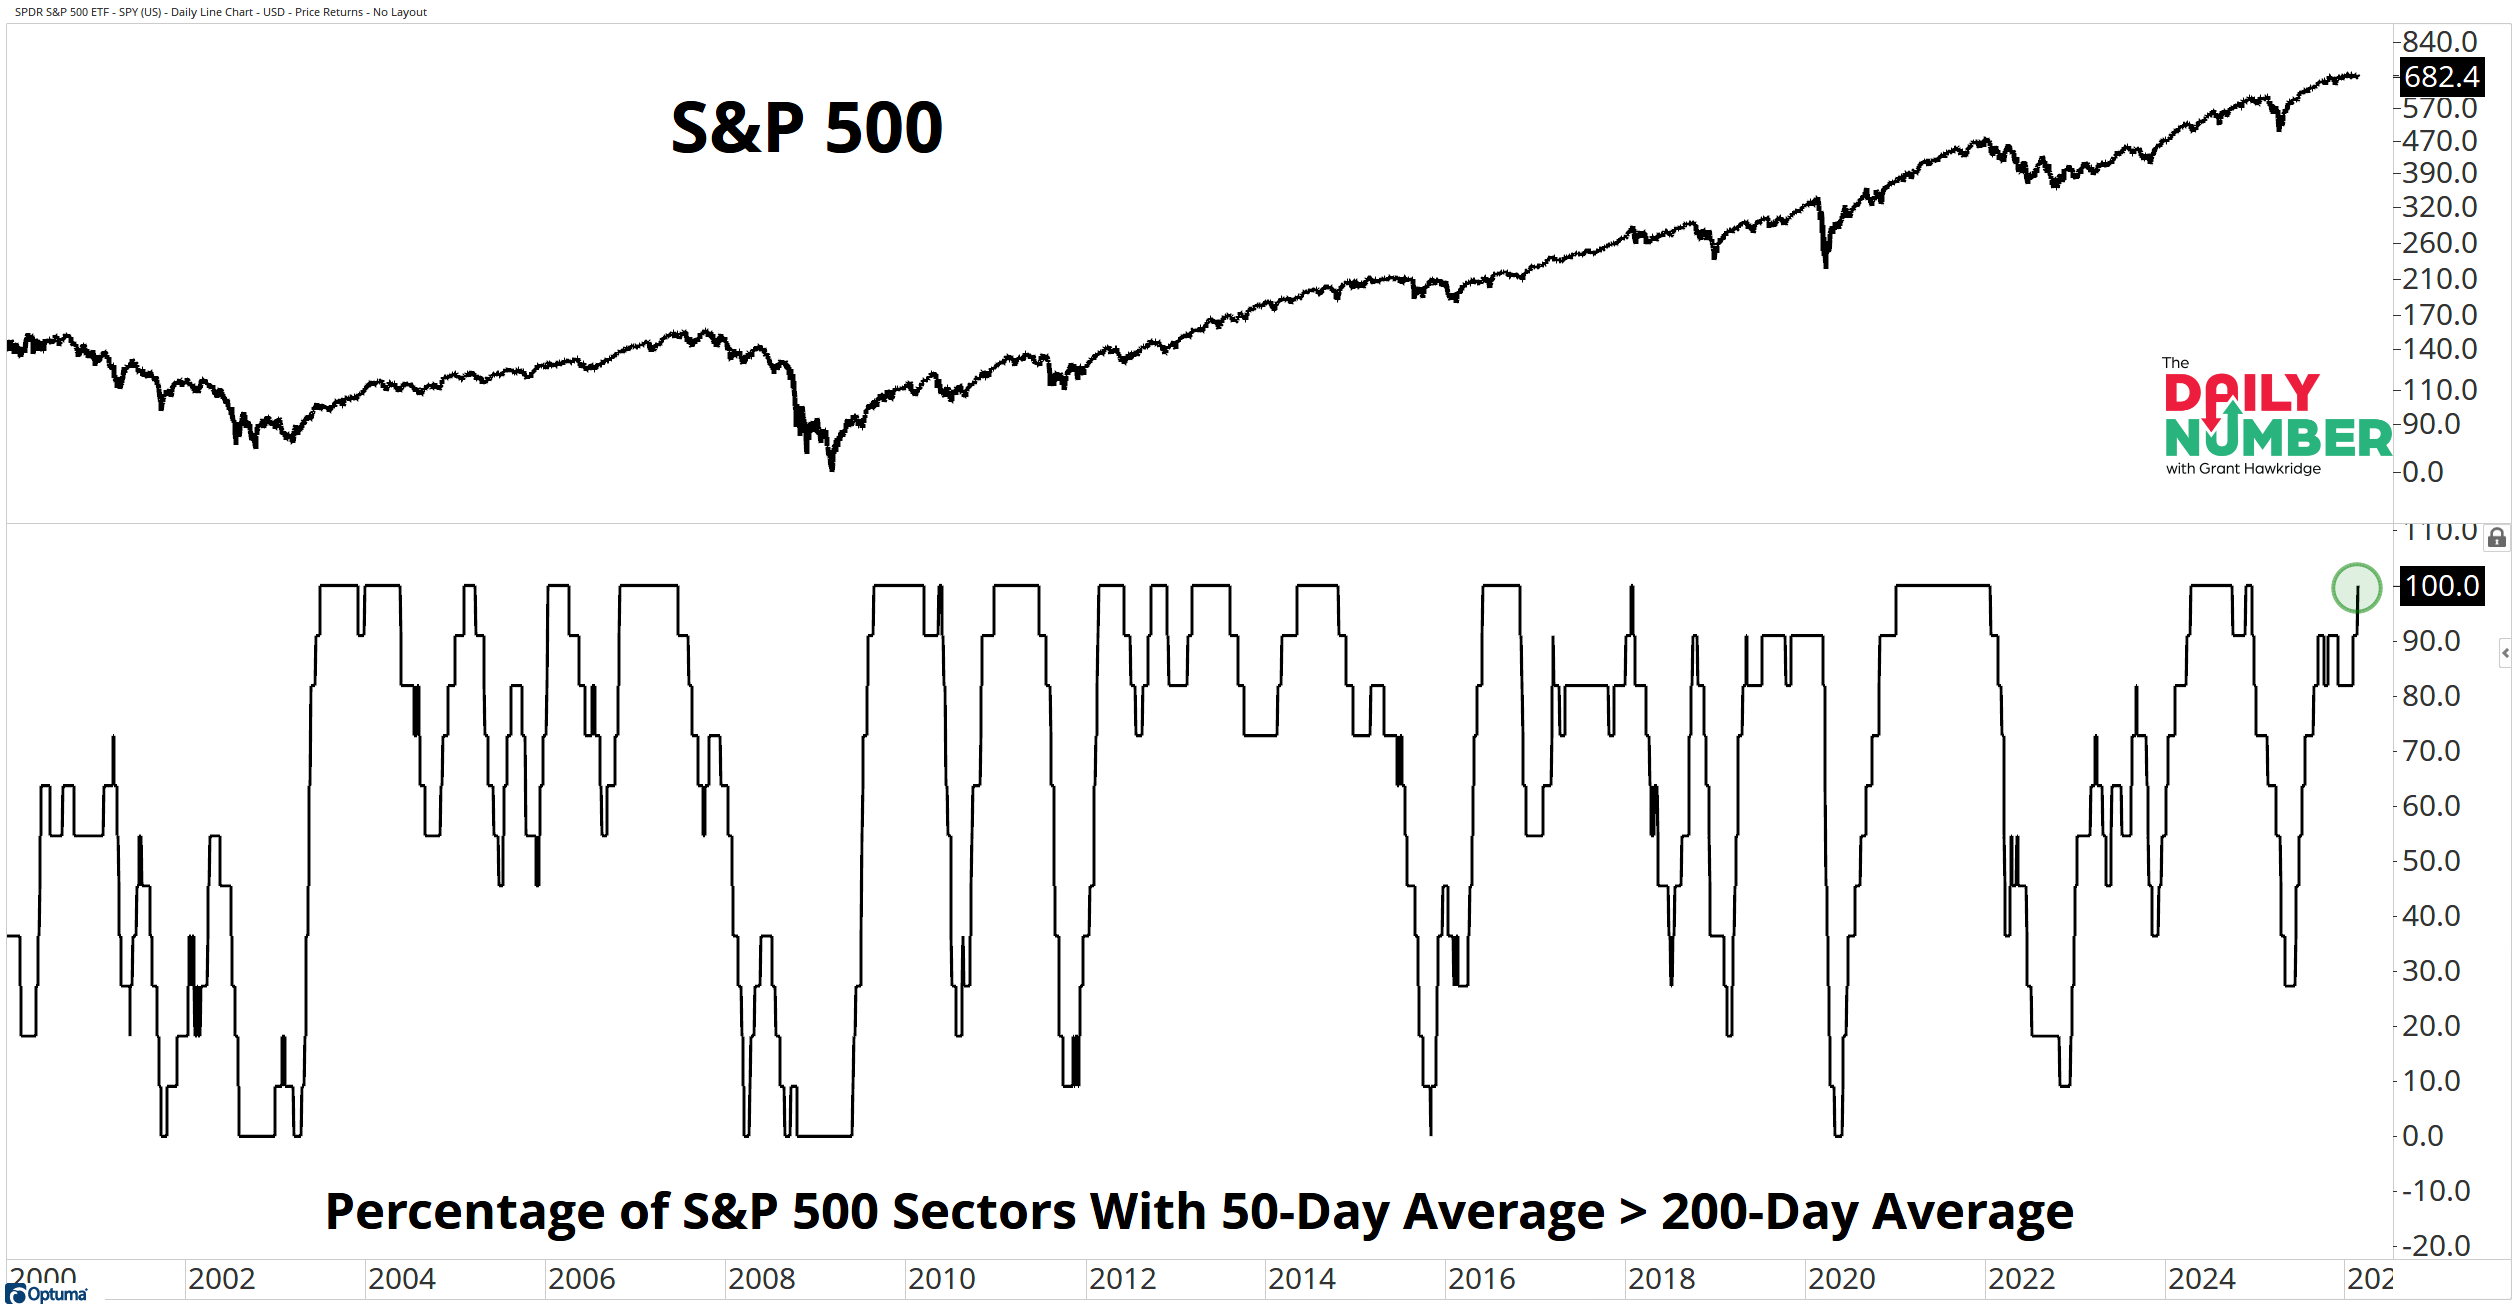
Let's break down what the chart shows:
The top pane displays the S&P 500 price in black.
The bottom pane displays a black line tracking the percentage of S&P 500 GICS sector indices whose 50-day moving average is above their 200-day moving average.
TheTakeaway: 100% means every S&P 500 sector has its 50-day moving average above its 200-day moving average. We have not seen that since December 2024.
This is broad market strength, not just one theme doing the heavy lifting. Energy sits 12.9% above its 50-day moving average and 23.0% above its 200-day moving average. Materials are 8.7% and 16.4% above. Industrials are 6.4% and 13.9% above.
Defense is not rolling over either. Utilities trade 7.3% above the 50-day and 8.8% above the 200-day. Staples sit 8.2% and 11.1% above. Money is flowing into both offense and defense at the same time. That is how bull market phases press higher.
The duration adds weight. Financials have held the 50-day moving average above the 200-day moving average for 557 straight days. Utilities sit at 468 days. Industrials are at 172 days. These trends have been in place for months, not weeks.
But some groups are cooling on shorter timeframes. Financials are 6.3% below the 50-day moving average. Tech is 3.4% below. Discretionary is 5.8% below. But most still hold above the 200-day, so the bigger trend remains intact.
The shift to watch now is rollover. If this breadth metric starts trending lower and sectors begin flipping out of their uptrends, strength narrows. That is when the advance might start to stall.
Right now, every sector is still in an uptrend. So, does this stay elevated on the next pullback, or do we see sector trends start breaking one by one?