If you missed it, I broke down this dashboard and how I actually use it in my process during my weekly show.
I’ll keep it short and sweet this week.
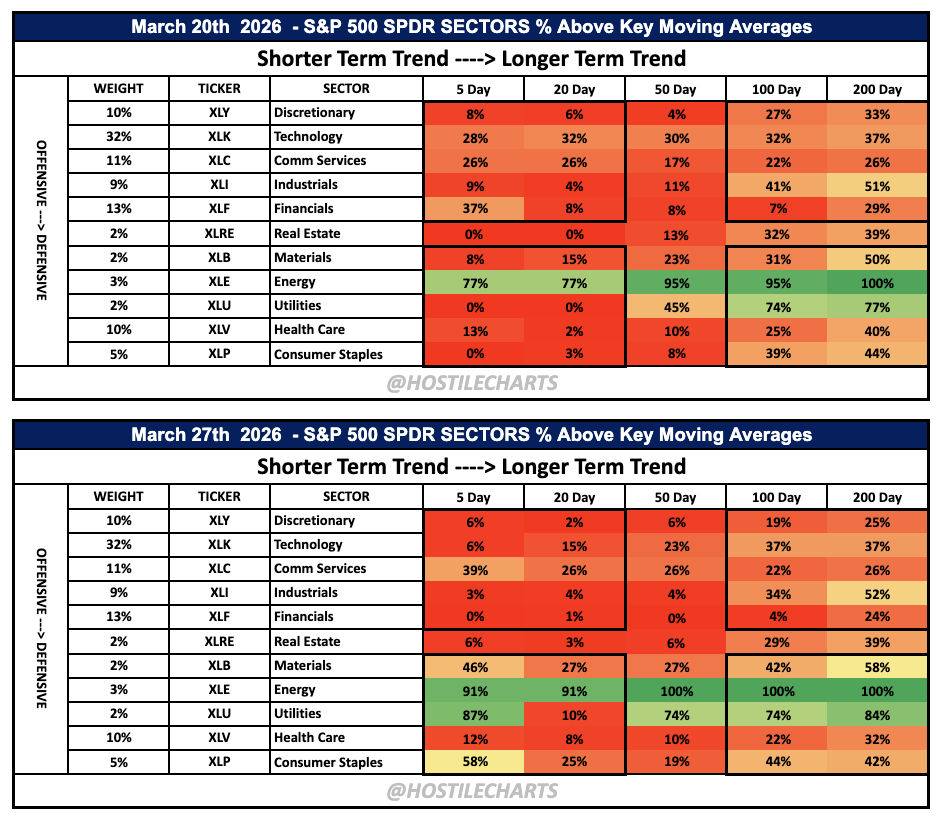
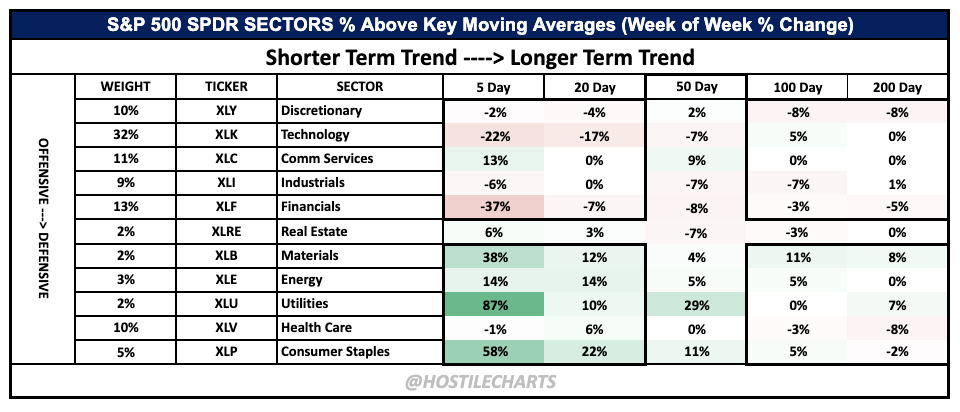
Breadth is still ugly. It’s basically Energy vs. everybody.
As Captain Obvious would say, we need to see participation broaden before there’s anything to get excited about in this market.
The Stalk List
Focusing on one chart this week and the implications it brings.
If you want to understand what I’m stalking in terms of a potential stock market bottom, check out the live show from Friday.
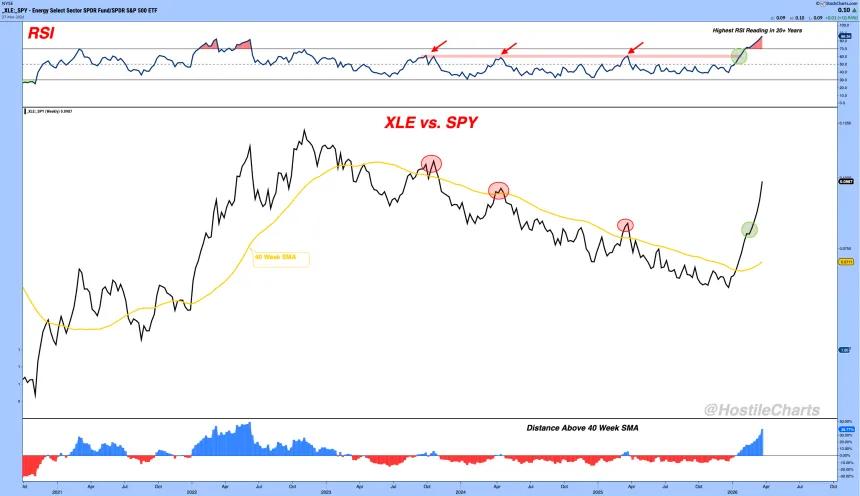
XLE vs. SPY - Energy Outperformance
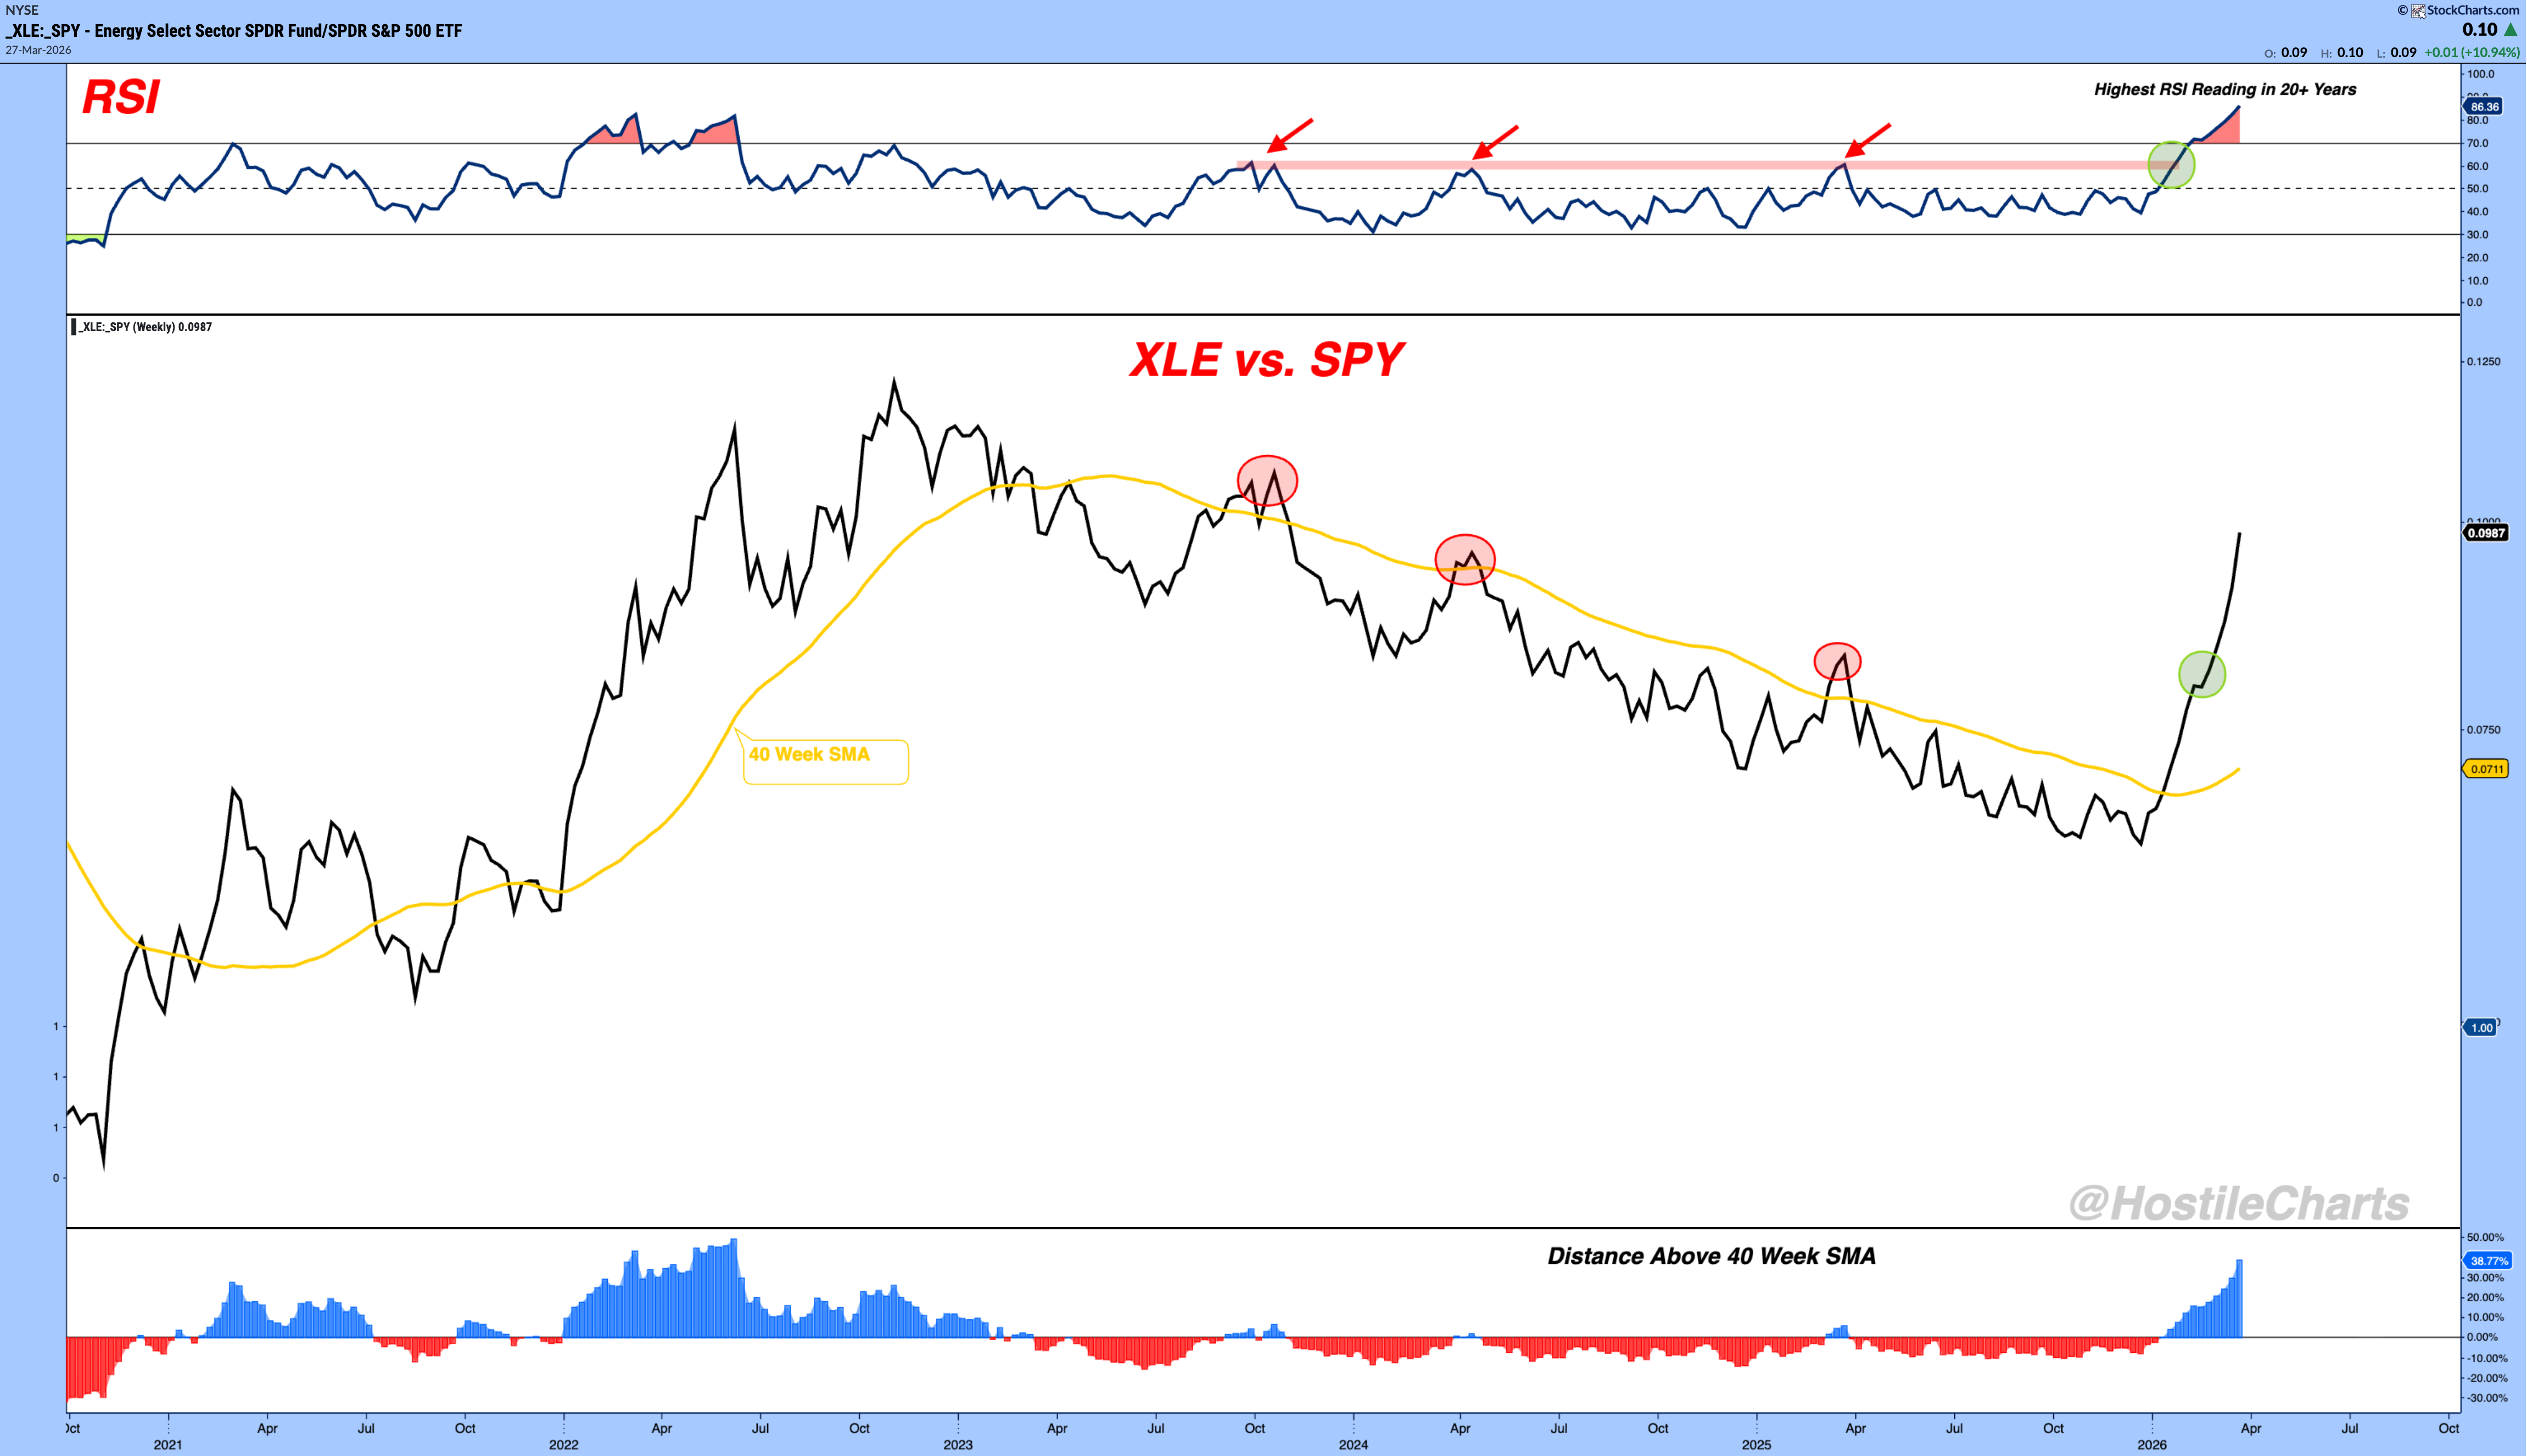
One of the main reasons I’ve been cautious comes down to this.
Energy is ripping relative to the market, and it doesn’t take a rocket scientist to understand that a sharp move higher in energy tends to create chaos.
Whether the chaos causes the move or the move reflects the chaos doesn’t really matter, the message is the same.
The XLE vs. SPY ratio is breaking out, and the RSI on that ratio is at its highest level in over 20 years.
Historically, when energy leads like this, it usually means one of two things.
Either the economy is running hot, inflationary boom type of environment, or there’s geopolitical stress pushing oil and commodities higher.
Either way, it’s typically not the kind of backdrop where the broad market thrives.
And when you look back more broadly, many market bottoms, including the 2025 TACO low, came when energy was underperforming, not leading.
That’s the key.
So this “stay on energy’s team” idea isn’t a hot take, it’s just following relative strength and momentum.
Until you see the S&P start to consistently outperform energy, meaning this ratio rolls over and RSI cools off, trying to play for a broad market recovery is just swimming upstream.
In a world where energy is leading like this, I want to see the rest of the market start making up ground before getting too excited.
Until then, stick with what’s working.....cash and energy.
Anyway, that's my two cents.
Sneak Peak - "FactCheck Me"
I don’t share much of my backtest work.
Not because I don’t want to, but because good data isn’t cheap and neither is the time it takes to do it right.
But if you’ve made it this far, here’s a preview of what I’ve been digging into.
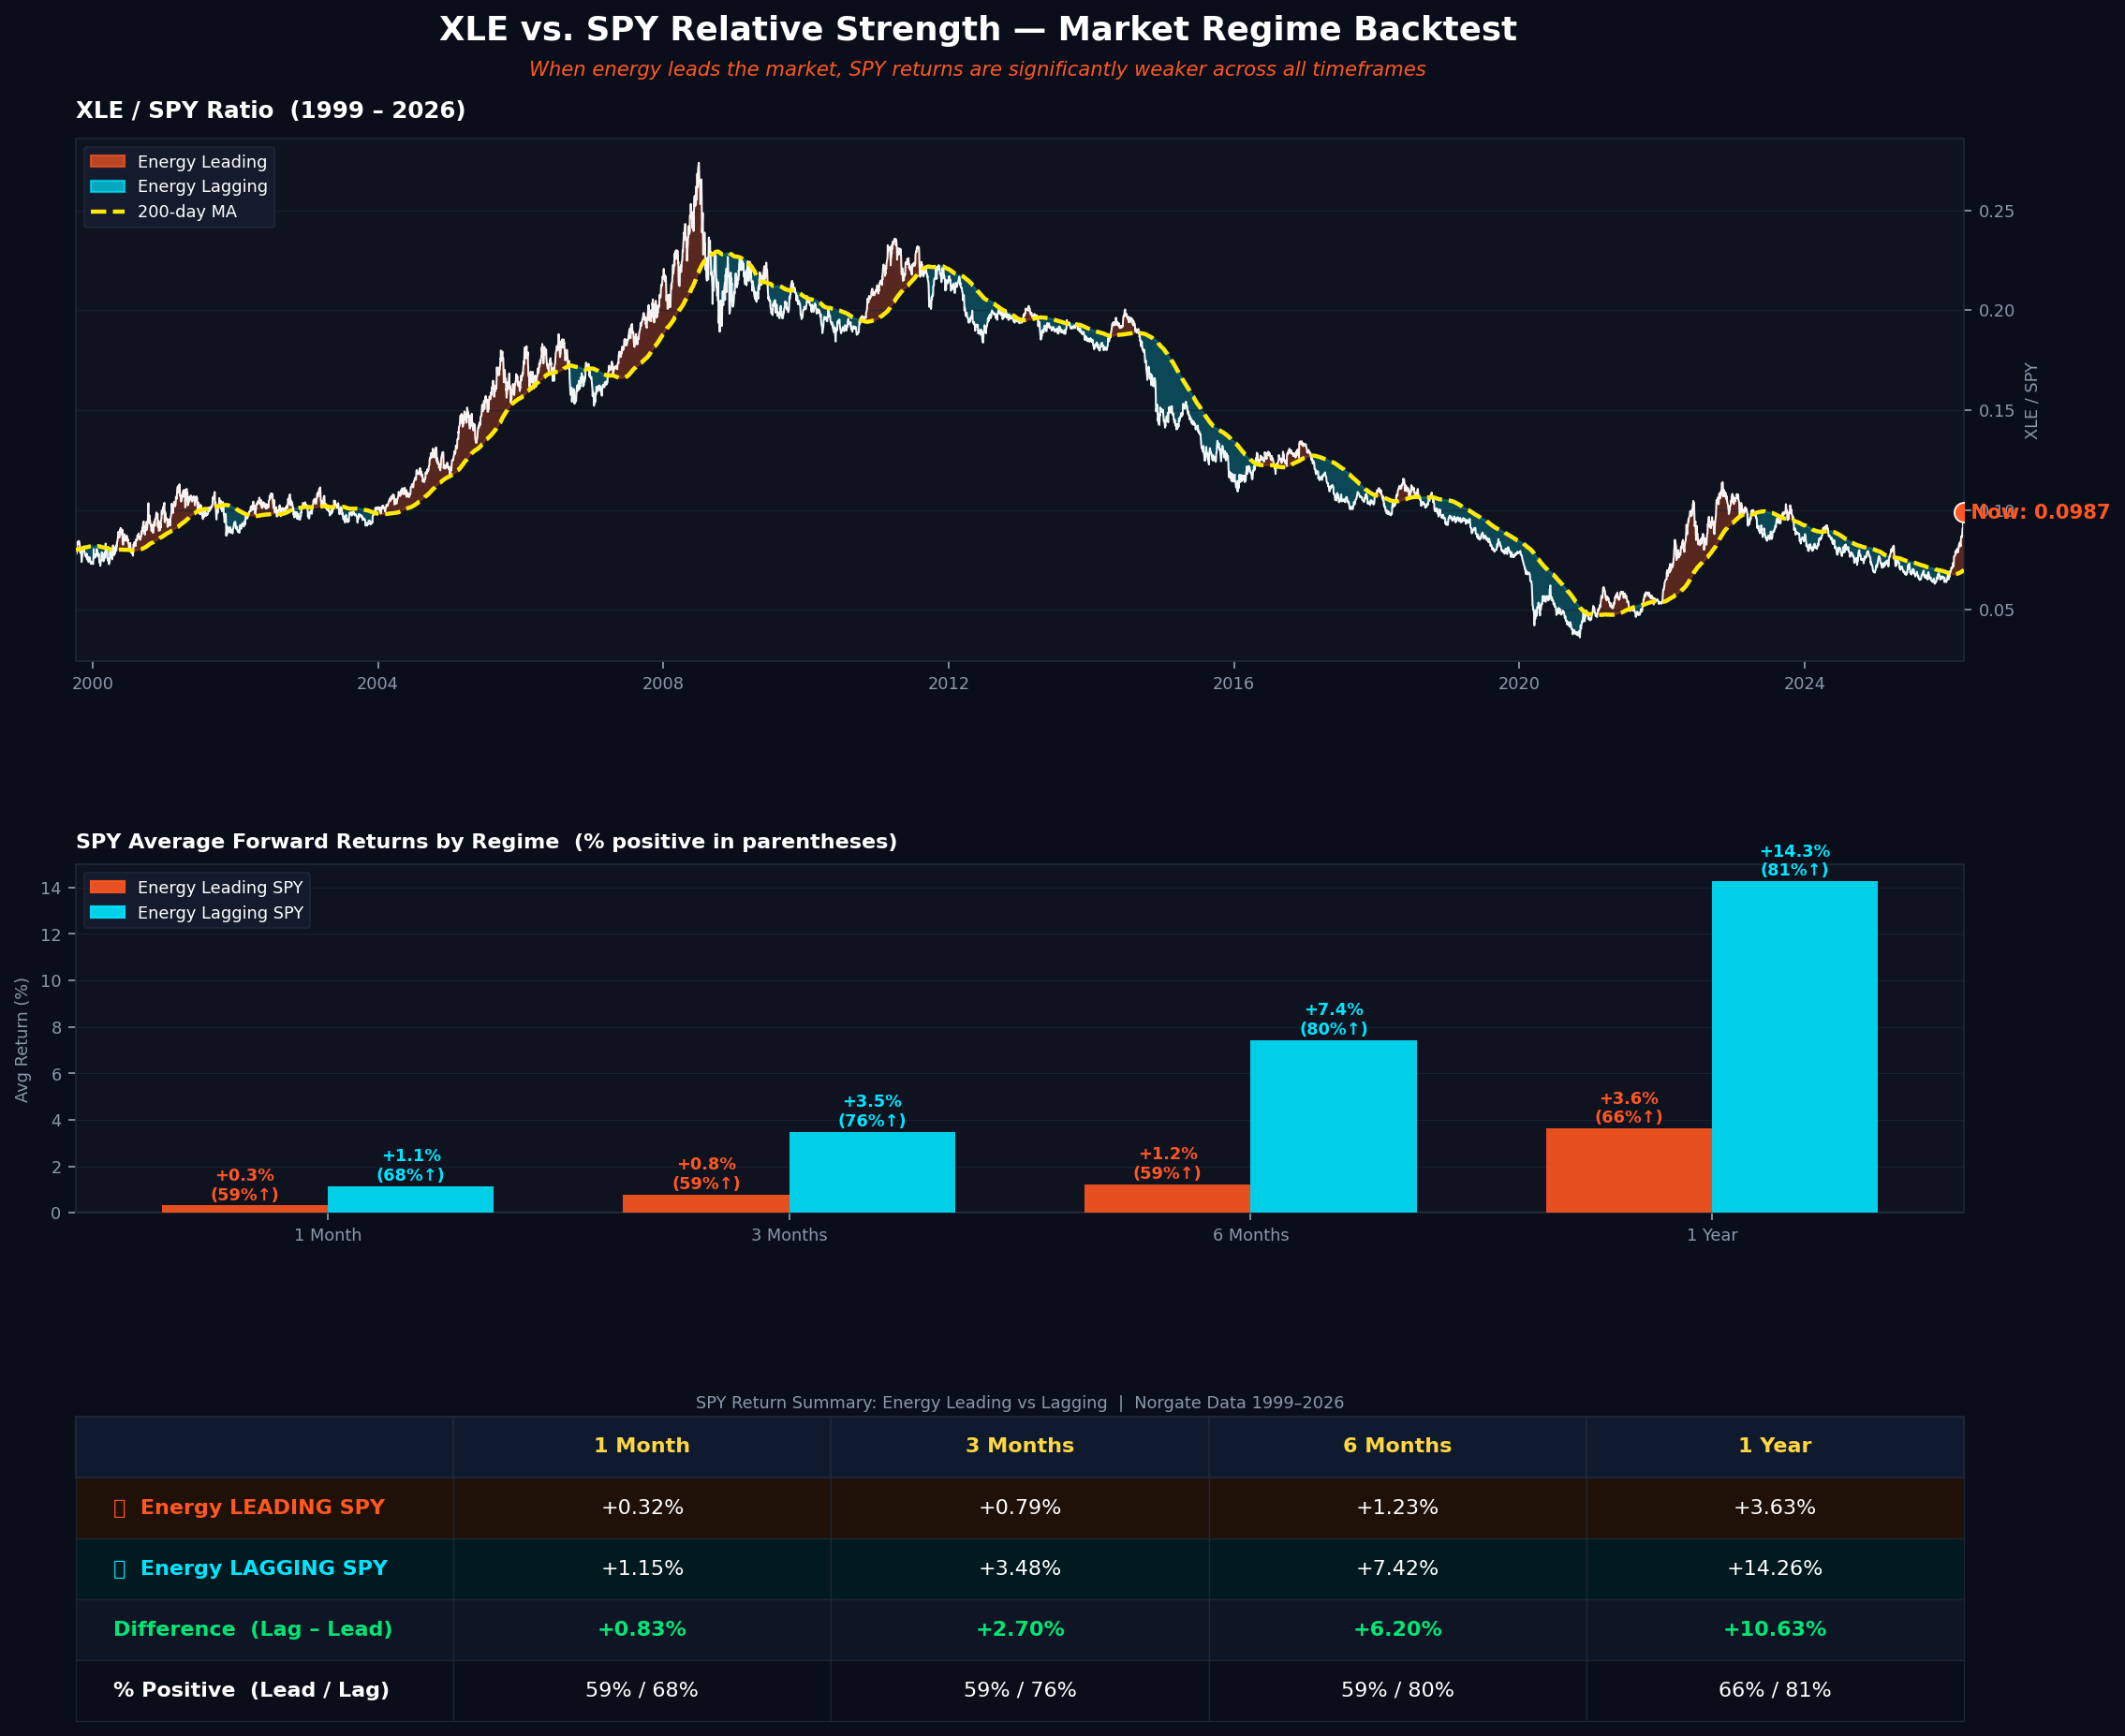
This XLE vs. SPY relationship isn’t just a “two cents” take. The data backs it.
When energy leads, forward returns for the S&P 500 consistently come in weaker across every timeframe.