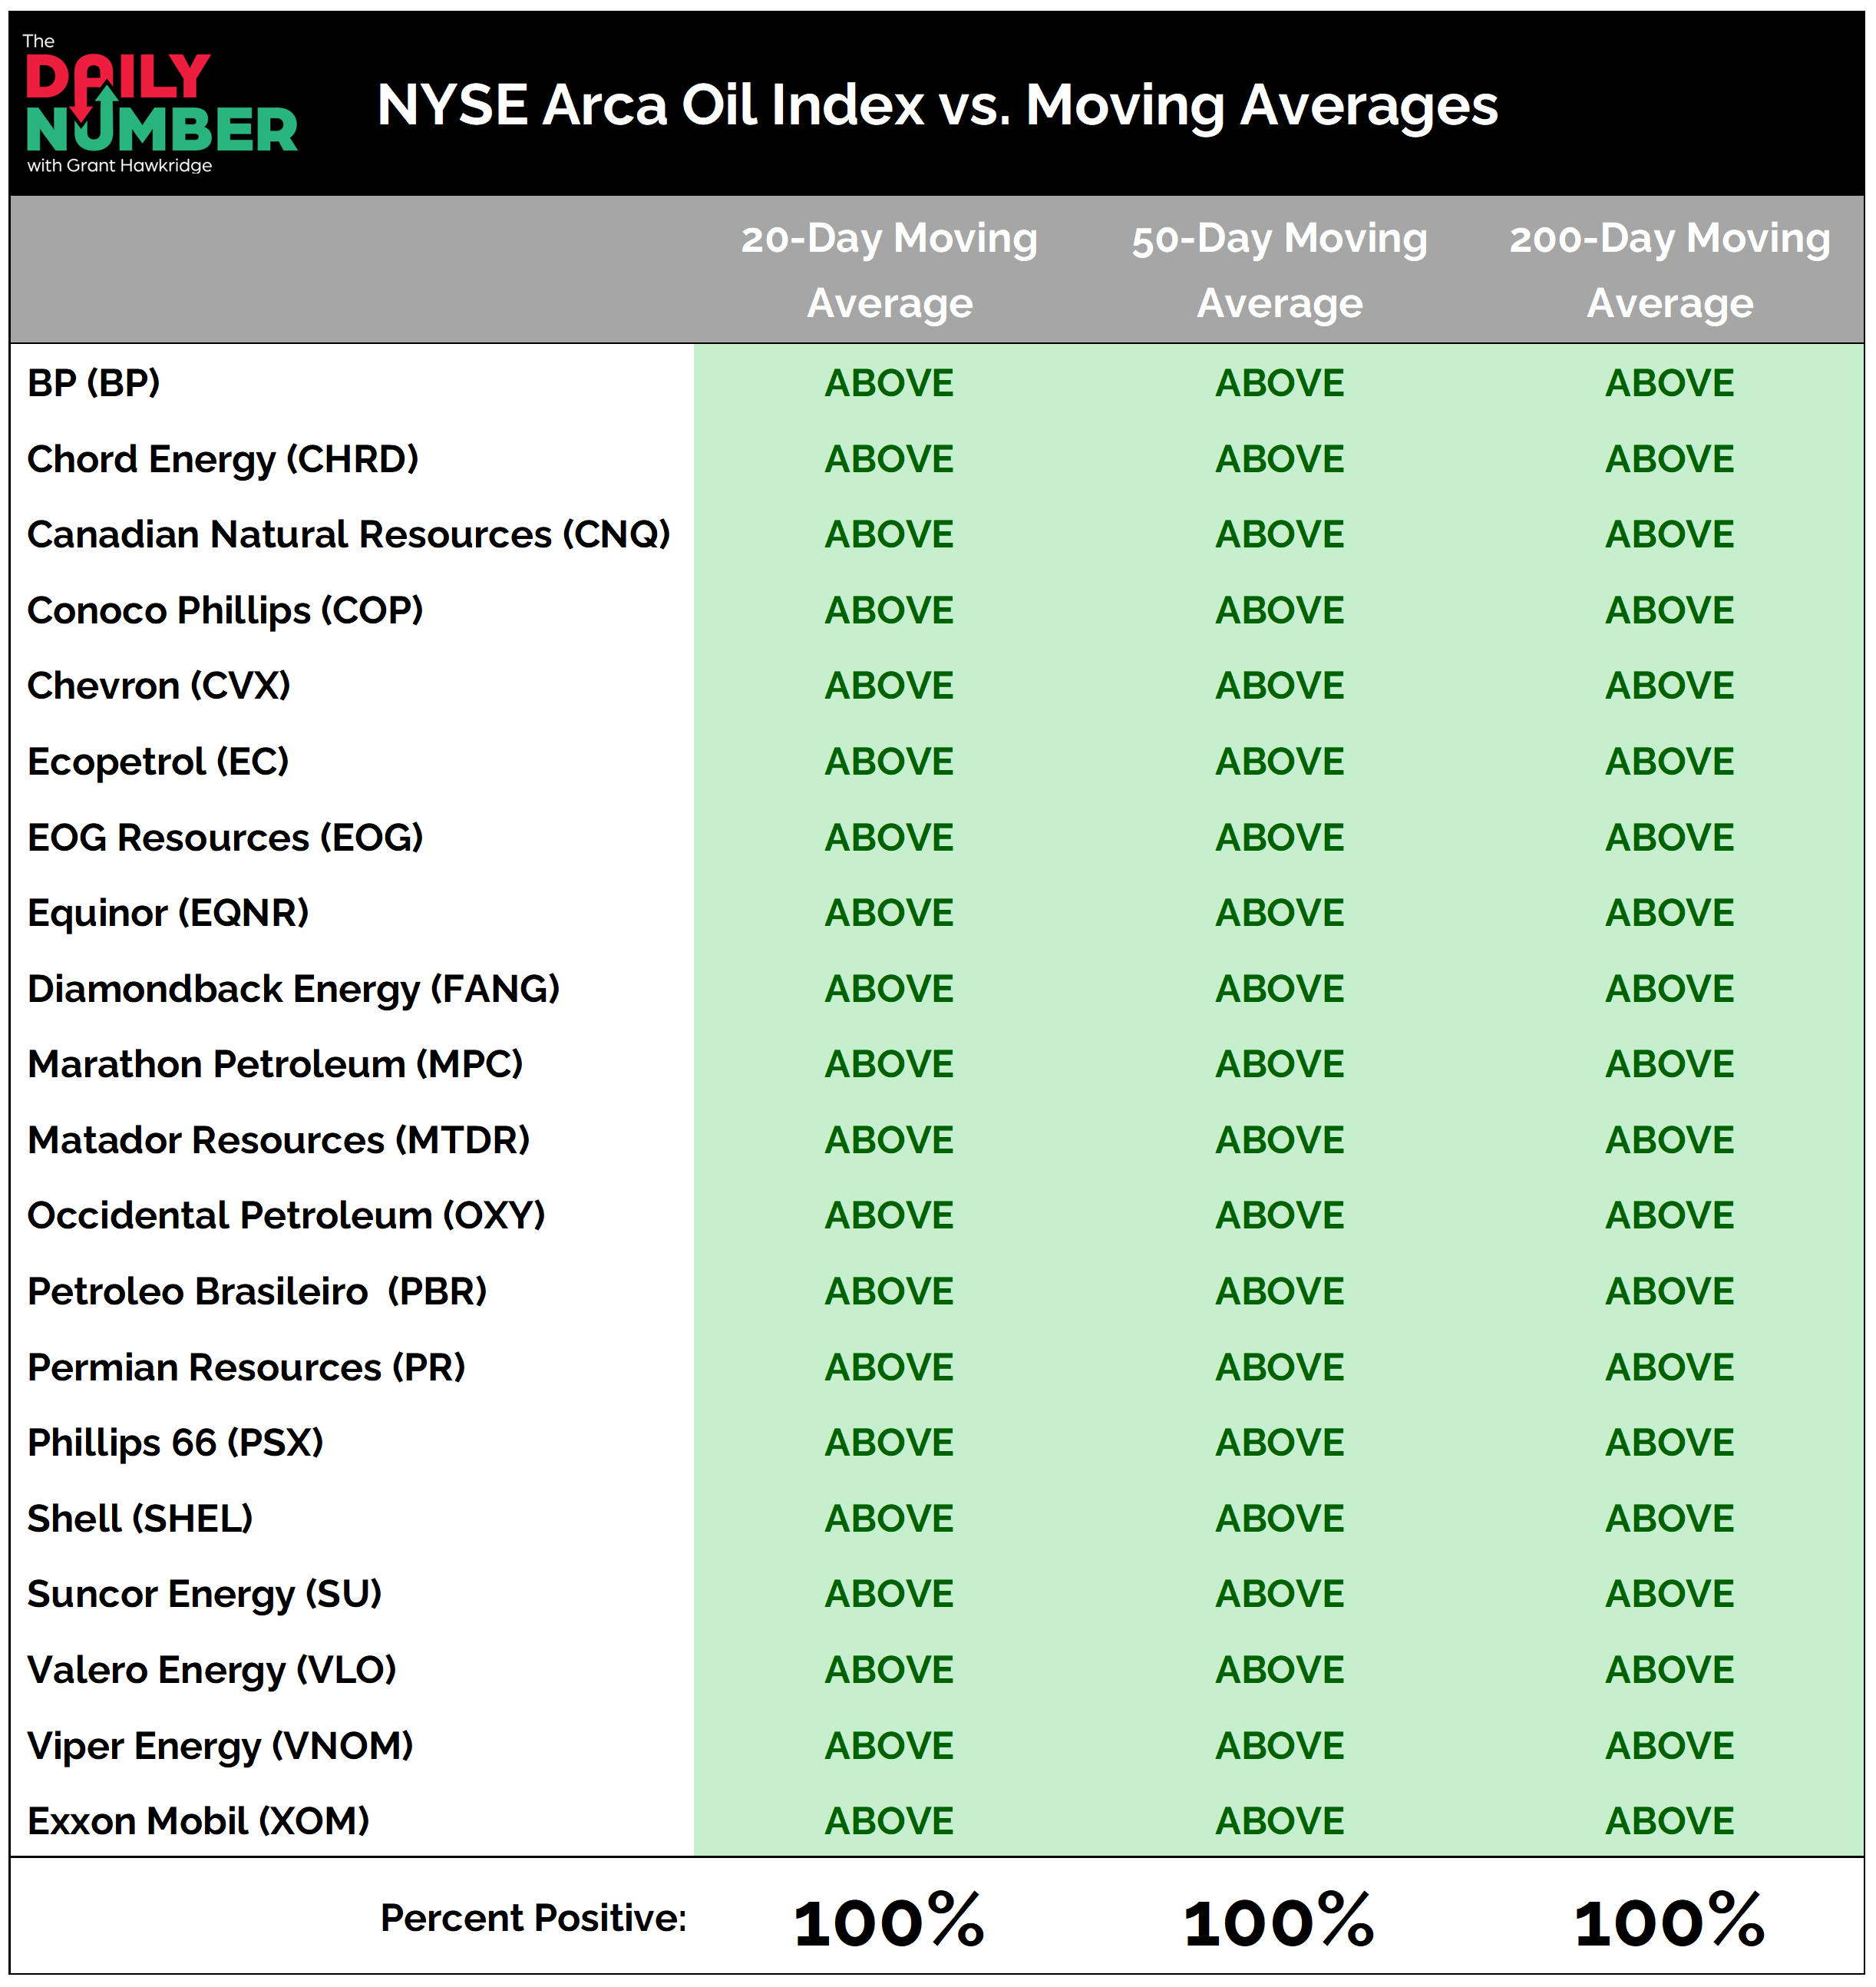
100% of the NYSE Arca Oil Index stocks in this table are trading above their 20-day moving average.
The same 100% reading also appears for the 50-day and 200-day moving averages.
Here’s the table:
Let's break down what the table shows:
The table lists 20 oil-related stocks from the NYSE Arca Oil Index.
Each row shows whether the stock is trading above or below its 20-day, 50-day, and 200-day moving averages.
Green shading marks stocks trading above the relevant moving average.
Red shading marks stocks trading below the relevant moving average.
The Takeaway: Every stock in this oil table is above its 20-day, 50-day, and 200-day moving averages.
That means the strength is not being carried by one or two names. It is showing up across the group.
The 20-day reading shows strong short-term momentum. Buyers are still supporting the near-term trend.
The 50-day reading adds another layer. It shows the move has carried beyond a quick bounce and into the medium-term trend.
Then we get the 200-day reading. That is the bigger confirmation. These stocks are not trying to recover from broken long-term trends. They are already trading above their major trends.
So the message is pretty clear… The market is rewarding oil exposure right now.
When every stock in a group is above all three moving averages, it speaks to broad participation.
But a 100% reading also deserves some respect.
When every name has already moved above its key moving averages, a lot of the obvious strength is already visible. That does not make the group bearish. It simply means the easy part of the move may already be behind us.
Oil is acting like leadership. From here, the job is not to chase the green. It is to separate the strongest names from the ones simply moving with the group.