After 43 consecutive days, the S&P 500 has risen above the 50 level on the daily RSI.
Here’s the chart:
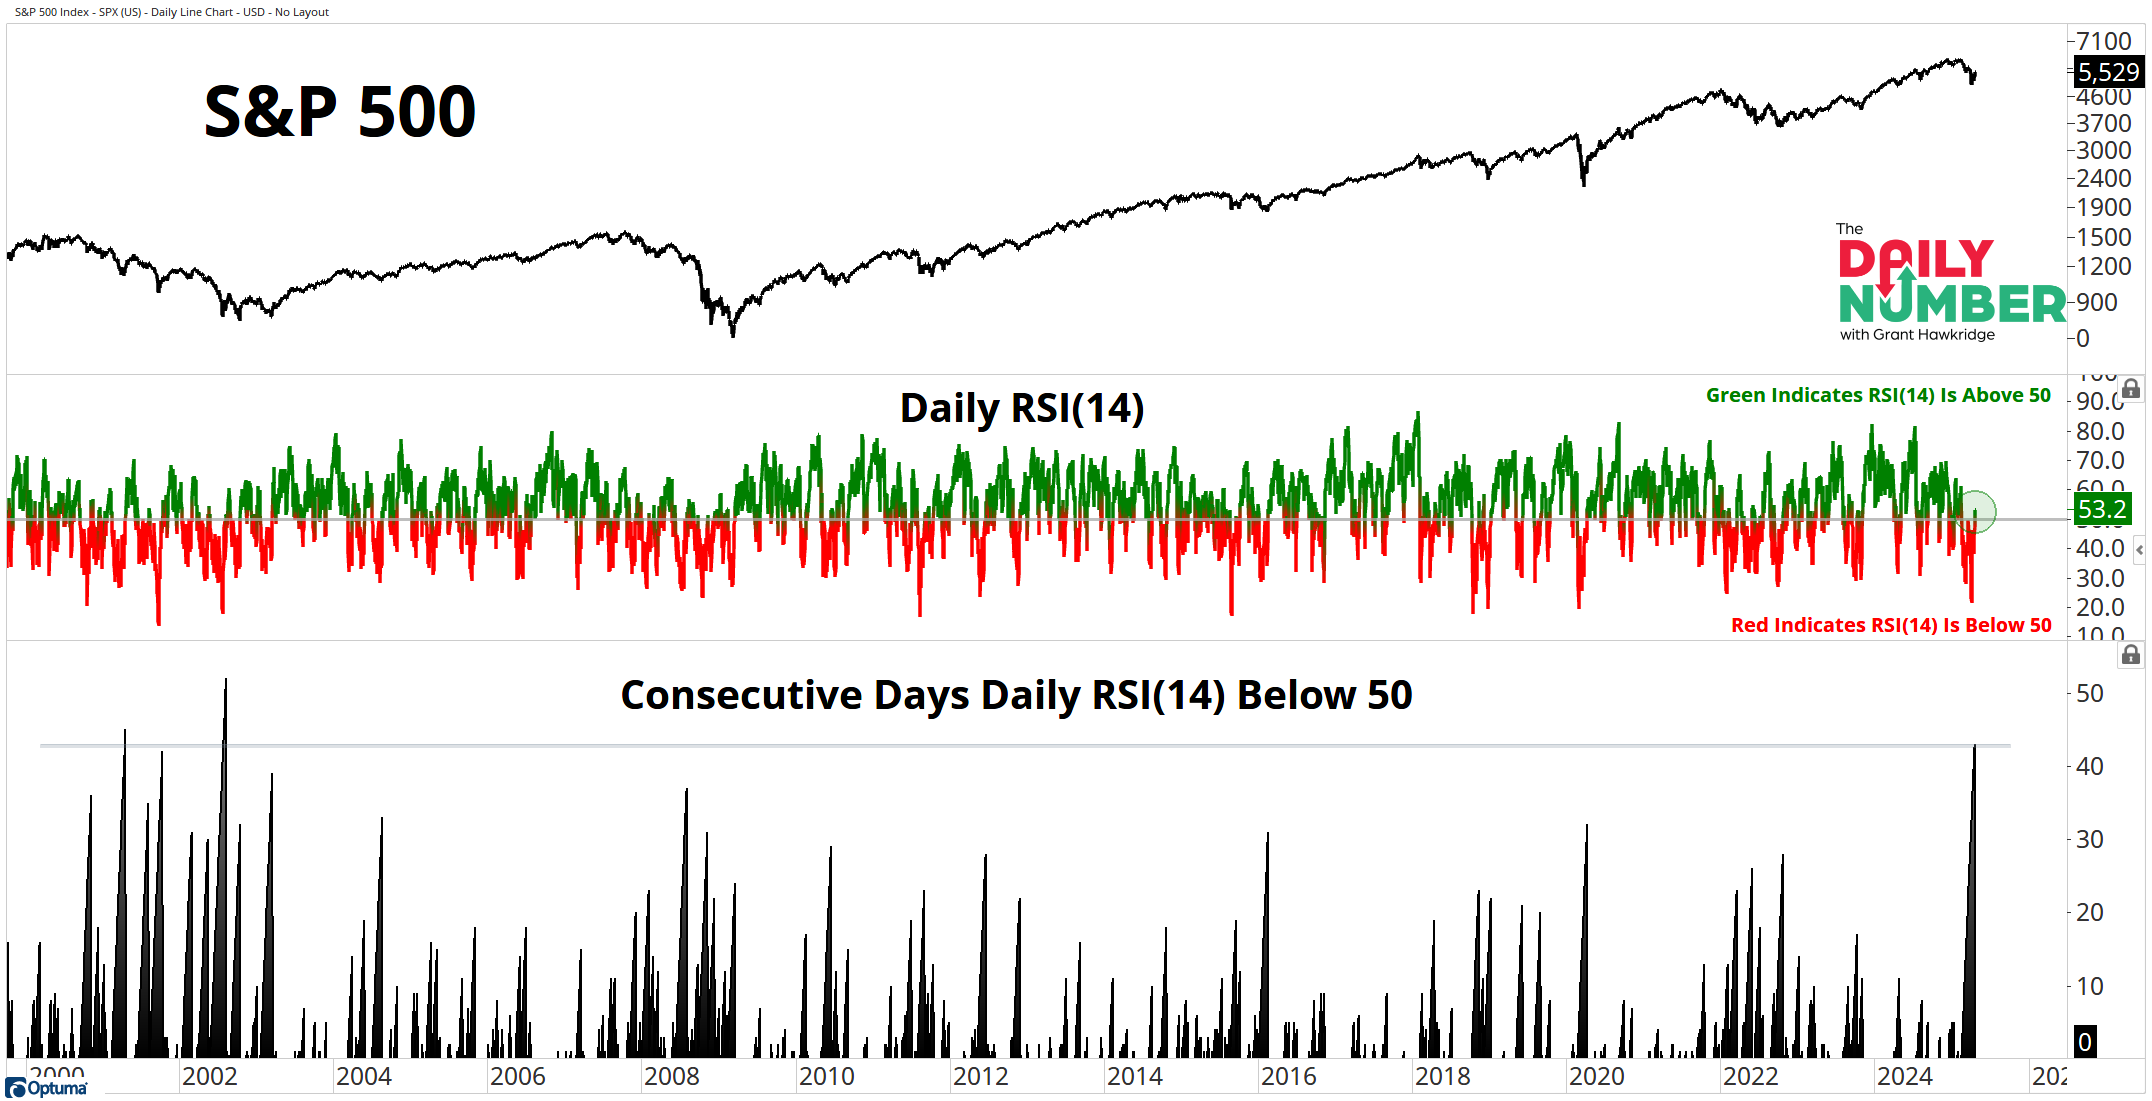
Let's break down what the chart shows:
The black line in the top panel is the S&P 500 index price.
The greenand redline in the middle panel represents the daily Relative Strength Index (RSI) for the S&P 500. When the line is green, it indicates that the daily RSI is above 50, while a red line signifies that the daily RSI is below 50.
The black line in the bottom panel shows how many consecutive days the daily RSI (14) has remained below the 50 level.
The Takeaway: The Relative Strength Index (RSI) is a momentum indicator that measures the speed and change of price movements. Recently, the daily RSI for the S&P 500 has climbed back above the 50 level after remaining below it for 43 consecutive days. This marks the longest period that the RSI has been below 50 since the market crash in 2002.
When the daily RSI of the S&P 500 falls below 50, it typically indicates we are in some form of market correction. This time was no exception, as the index experienced a decline of over 15% while the RSI remained below 50.
However, with this shift back above 50, it suggests that the bulls are trying to initiate a recovery. This is definitely a data point I will be placing in the Bulls bucket in my weight-of-the-evidence approach.
Do you think the Bulls will continue to build on this momentum?
If you find my content valuable, I would greatly appreciate it if you could share it with your friends, family, and colleagues. Your help in spreading the word is invaluable in supporting our work. Thank you to all of you who share!