Sentiment Shift: Bears Lose Streak, Bulls Take the Mic🎤
May 27, 2025
Today's number is... 15
AAII Sentiment finally flips after 15 weeks of more Bears than Bulls.
Here’s the chart:
Let's break down what the chart shows:
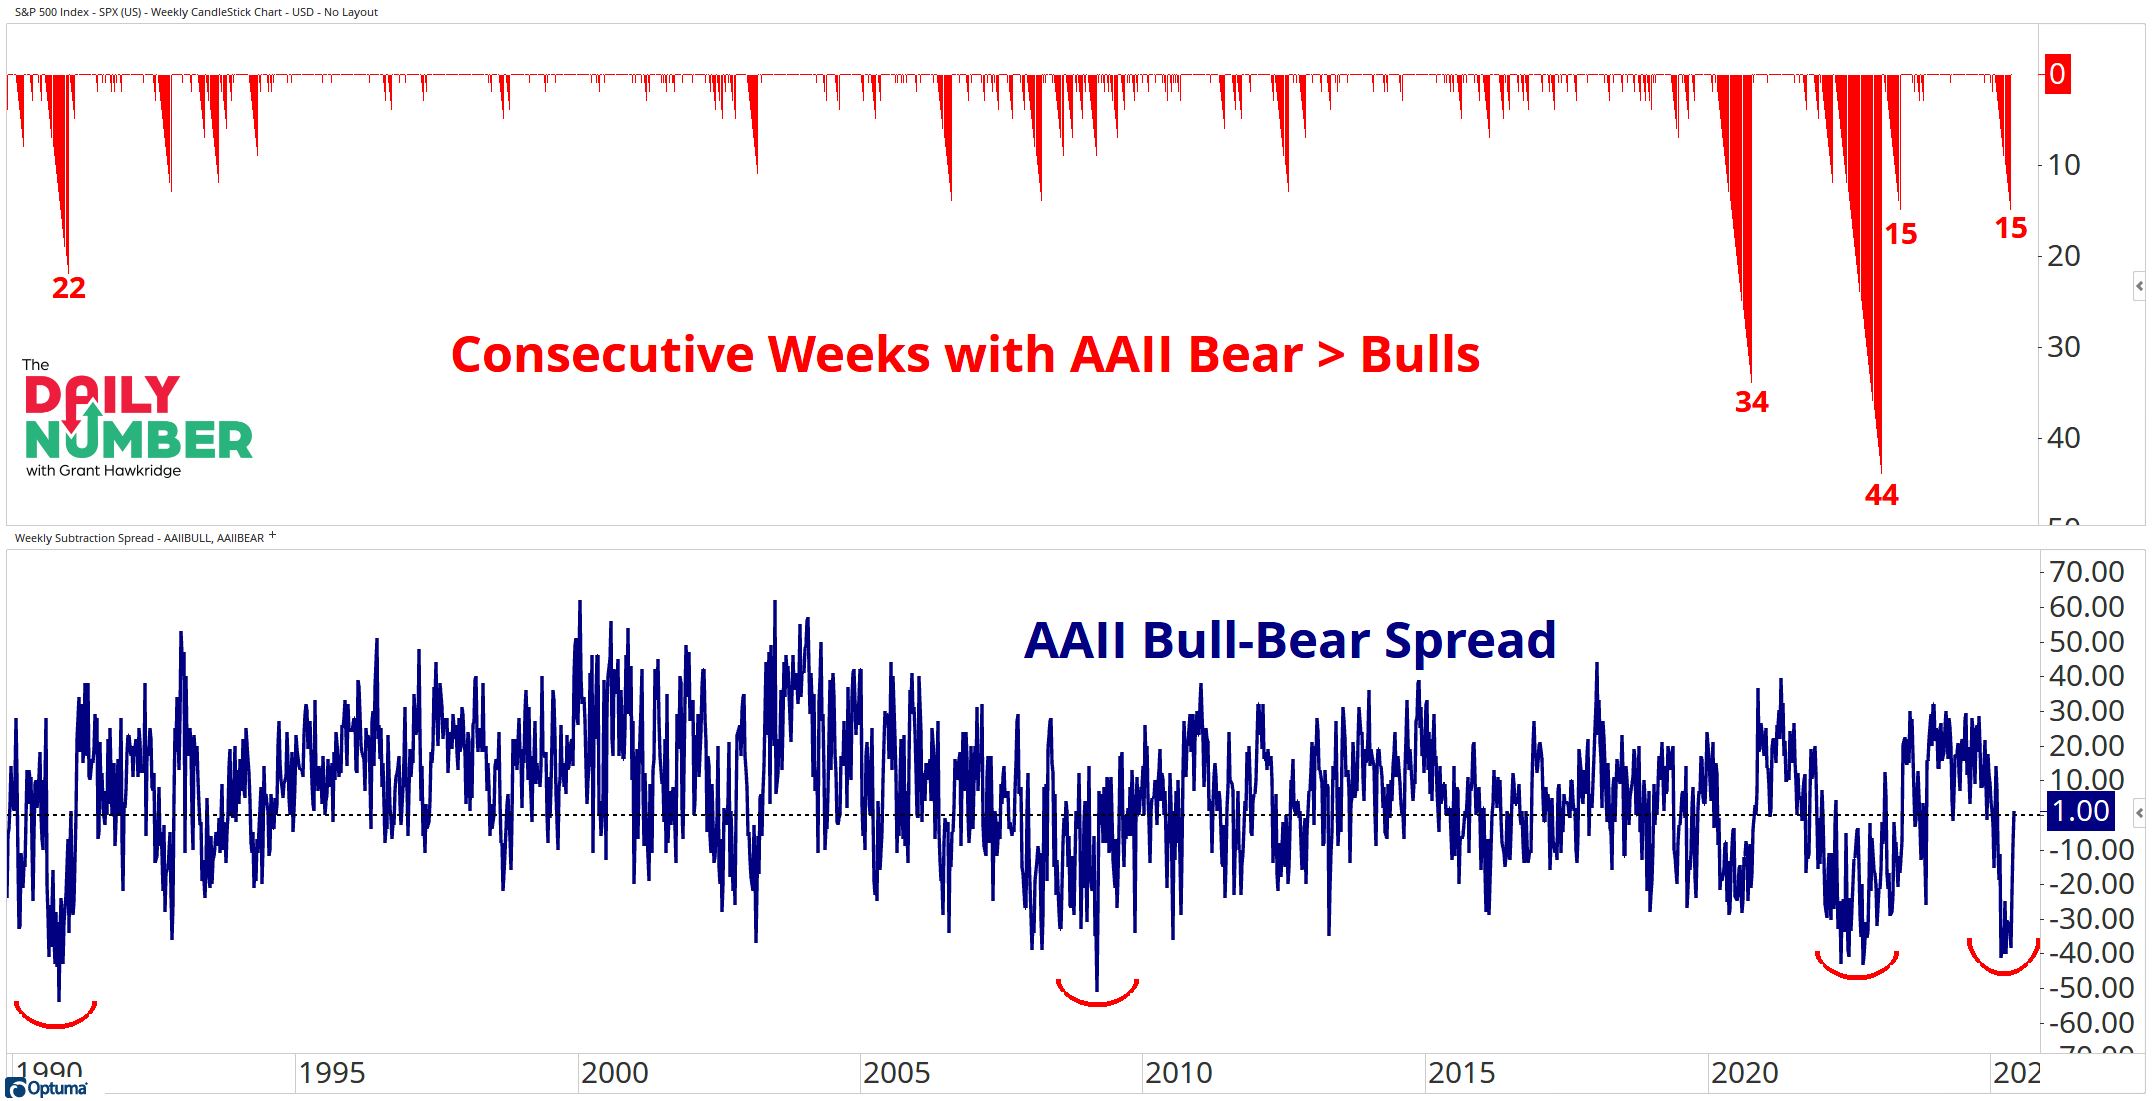
The red line in the top panelshows the consecutive weeks the AAII Bears were greater than the AAII Bulls.
The blue line in the bottom panel shows the AAII Bull-Bears spread.
The Takeaway: The tide has finally turned after 15 straight weeks of more Bears than Bulls in the AAII Investor Sentiment Survey.
Bulls are now back on top!
This was the fifth-longest bearish stretch on record, going back to the 1990s. During this bearish sentiment run, the AAII bull-bear spread dropped to levels we last saw during the 2022 cost-of-living bear market and the 2008 financial crisis.
Now the tone has changed.
It’s a good reminder of how quickly sentiment can shift when price rips higher.
What does this mean going forward?
Long periods of pessimism can create fuel for upside, especially if the market starts showing strength. That’s the setup we’re watching right now!
Still, sentiment isn’t a trading signal. It won’t tell you when to act. But after such a long run of bearish sentiment, this flip is worth noting. It shows how negative investors had become.... and how fast that can reverse.
The question now is...
Does this optimism hold up? Or does it fade the next time the market wobbles?
If you find my content valuable, I would greatly appreciate it if you could share it with your friends, family, and colleagues. Your help in spreading the word is invaluable in supporting our work. Thank you to all of you who share!