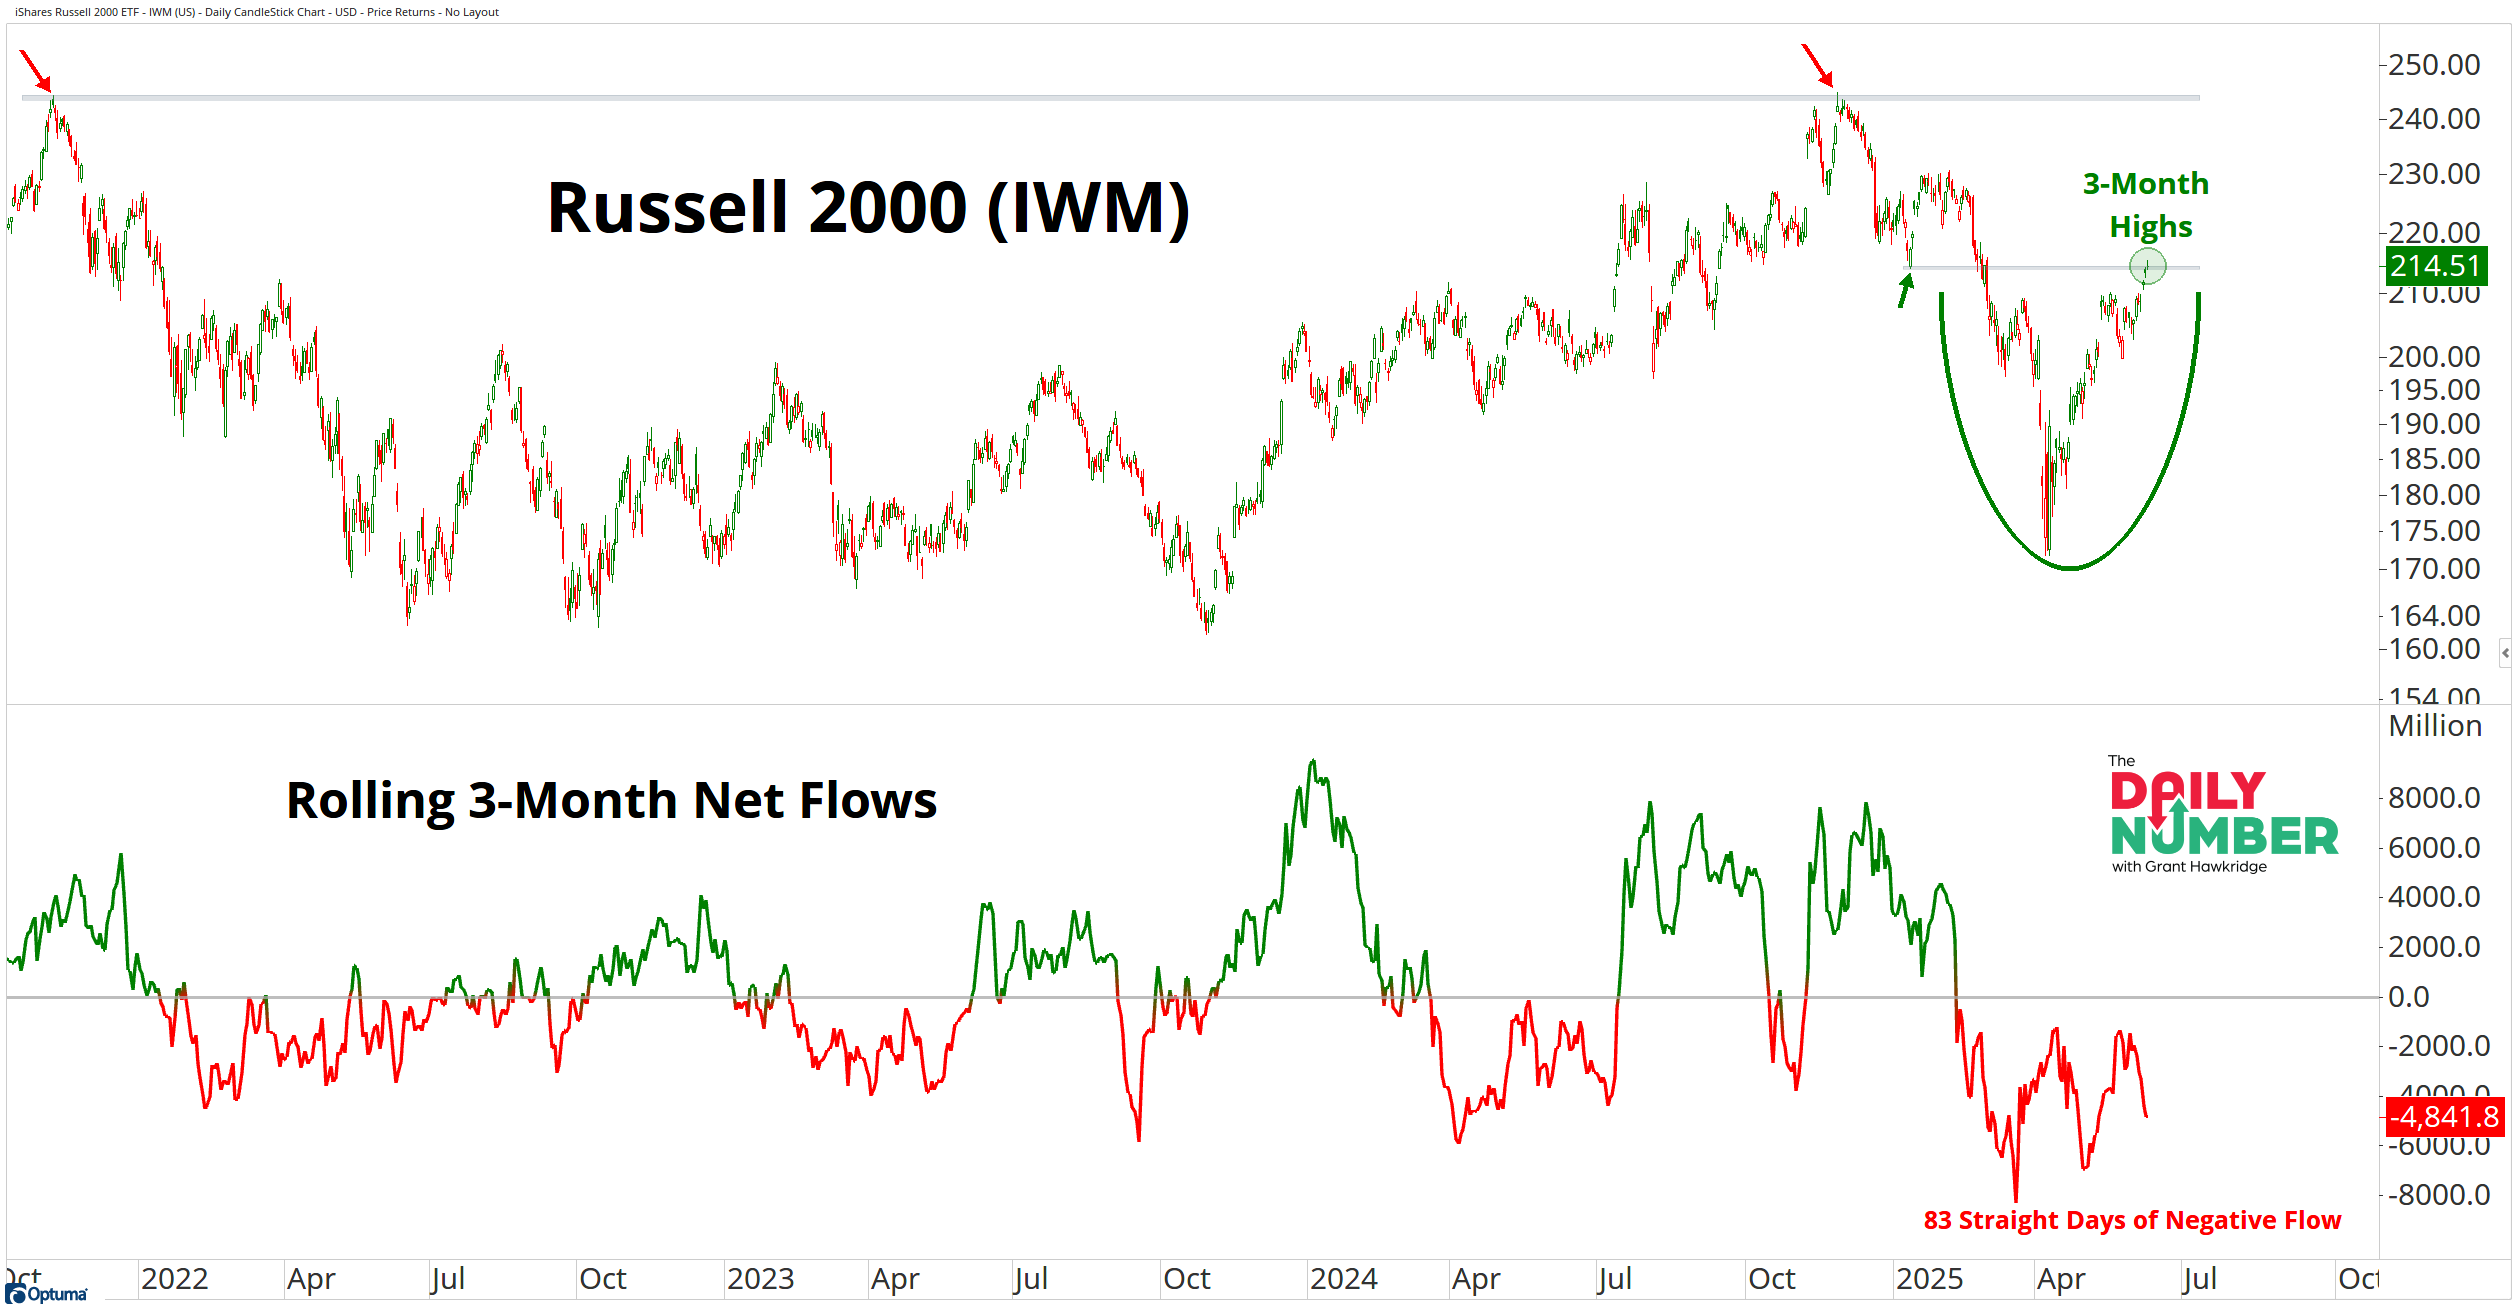
We’ve now seen 83 consecutive trading days where the 3-month rolling fund flow for the Russell 2000 (IWM) has been negative — a stretch small caps haven’t experienced since mid-2019.
Here’s the chart:
Let's break down what the chart shows:
The green and red candlesticks in the top panel show the price of the Russell 2000.
The green and red line in the bottom panel shows the rolling 3-month net fund flows for the Russell 2000.
The Takeaway: Nobody wants small caps right now.
And that’s exactly why I’m watching them.
Negative flows for this long isn’t just rare — it’s a clear sign of bearish sentiment.
Historically, when flows dry up like this, it reflects a market that’s been abandoned… and often sets the stage for a reversal.
But it’s not just fund flows.
Short interest in small caps is near 18-month highs.
Traders are leaning heavily against the space — and that kind of crowding rarely ends quietly.
It has also been 899 days since IWM last reached an all-time high.
Despite all the negativity, IWM has just reclaimed a key short-term level and printed fresh 3-month highs, and is now only 11.6% below its all-time high from 2021.
It’s quietly improving while no one’s watching.
No one’s positioned for small caps.
No one’s talking about them.
But when expectations are this low… the upside surprise tends to hit the hardest.
Grant Hawkridge | Chief Aussie Operator, All Star Charts
Need a full trading toolkit that actually helps you make moves? All Star Charts Premium gives you daily trade ideas, proprietary scans, and access to our entire analyst team. If you're serious about leveling up your strategy,start here.
If you find my content valuable, I would greatly appreciate it if you could share it with your friends, family, and colleagues. Your help in spreading the word is invaluable in supporting our work. Thank you to all of you who share!