My Core Leadership Model — a composite of short-, intermediate-, and long-term breadth is sitting firmly in the strong leadership zone.
Here’s the chart:
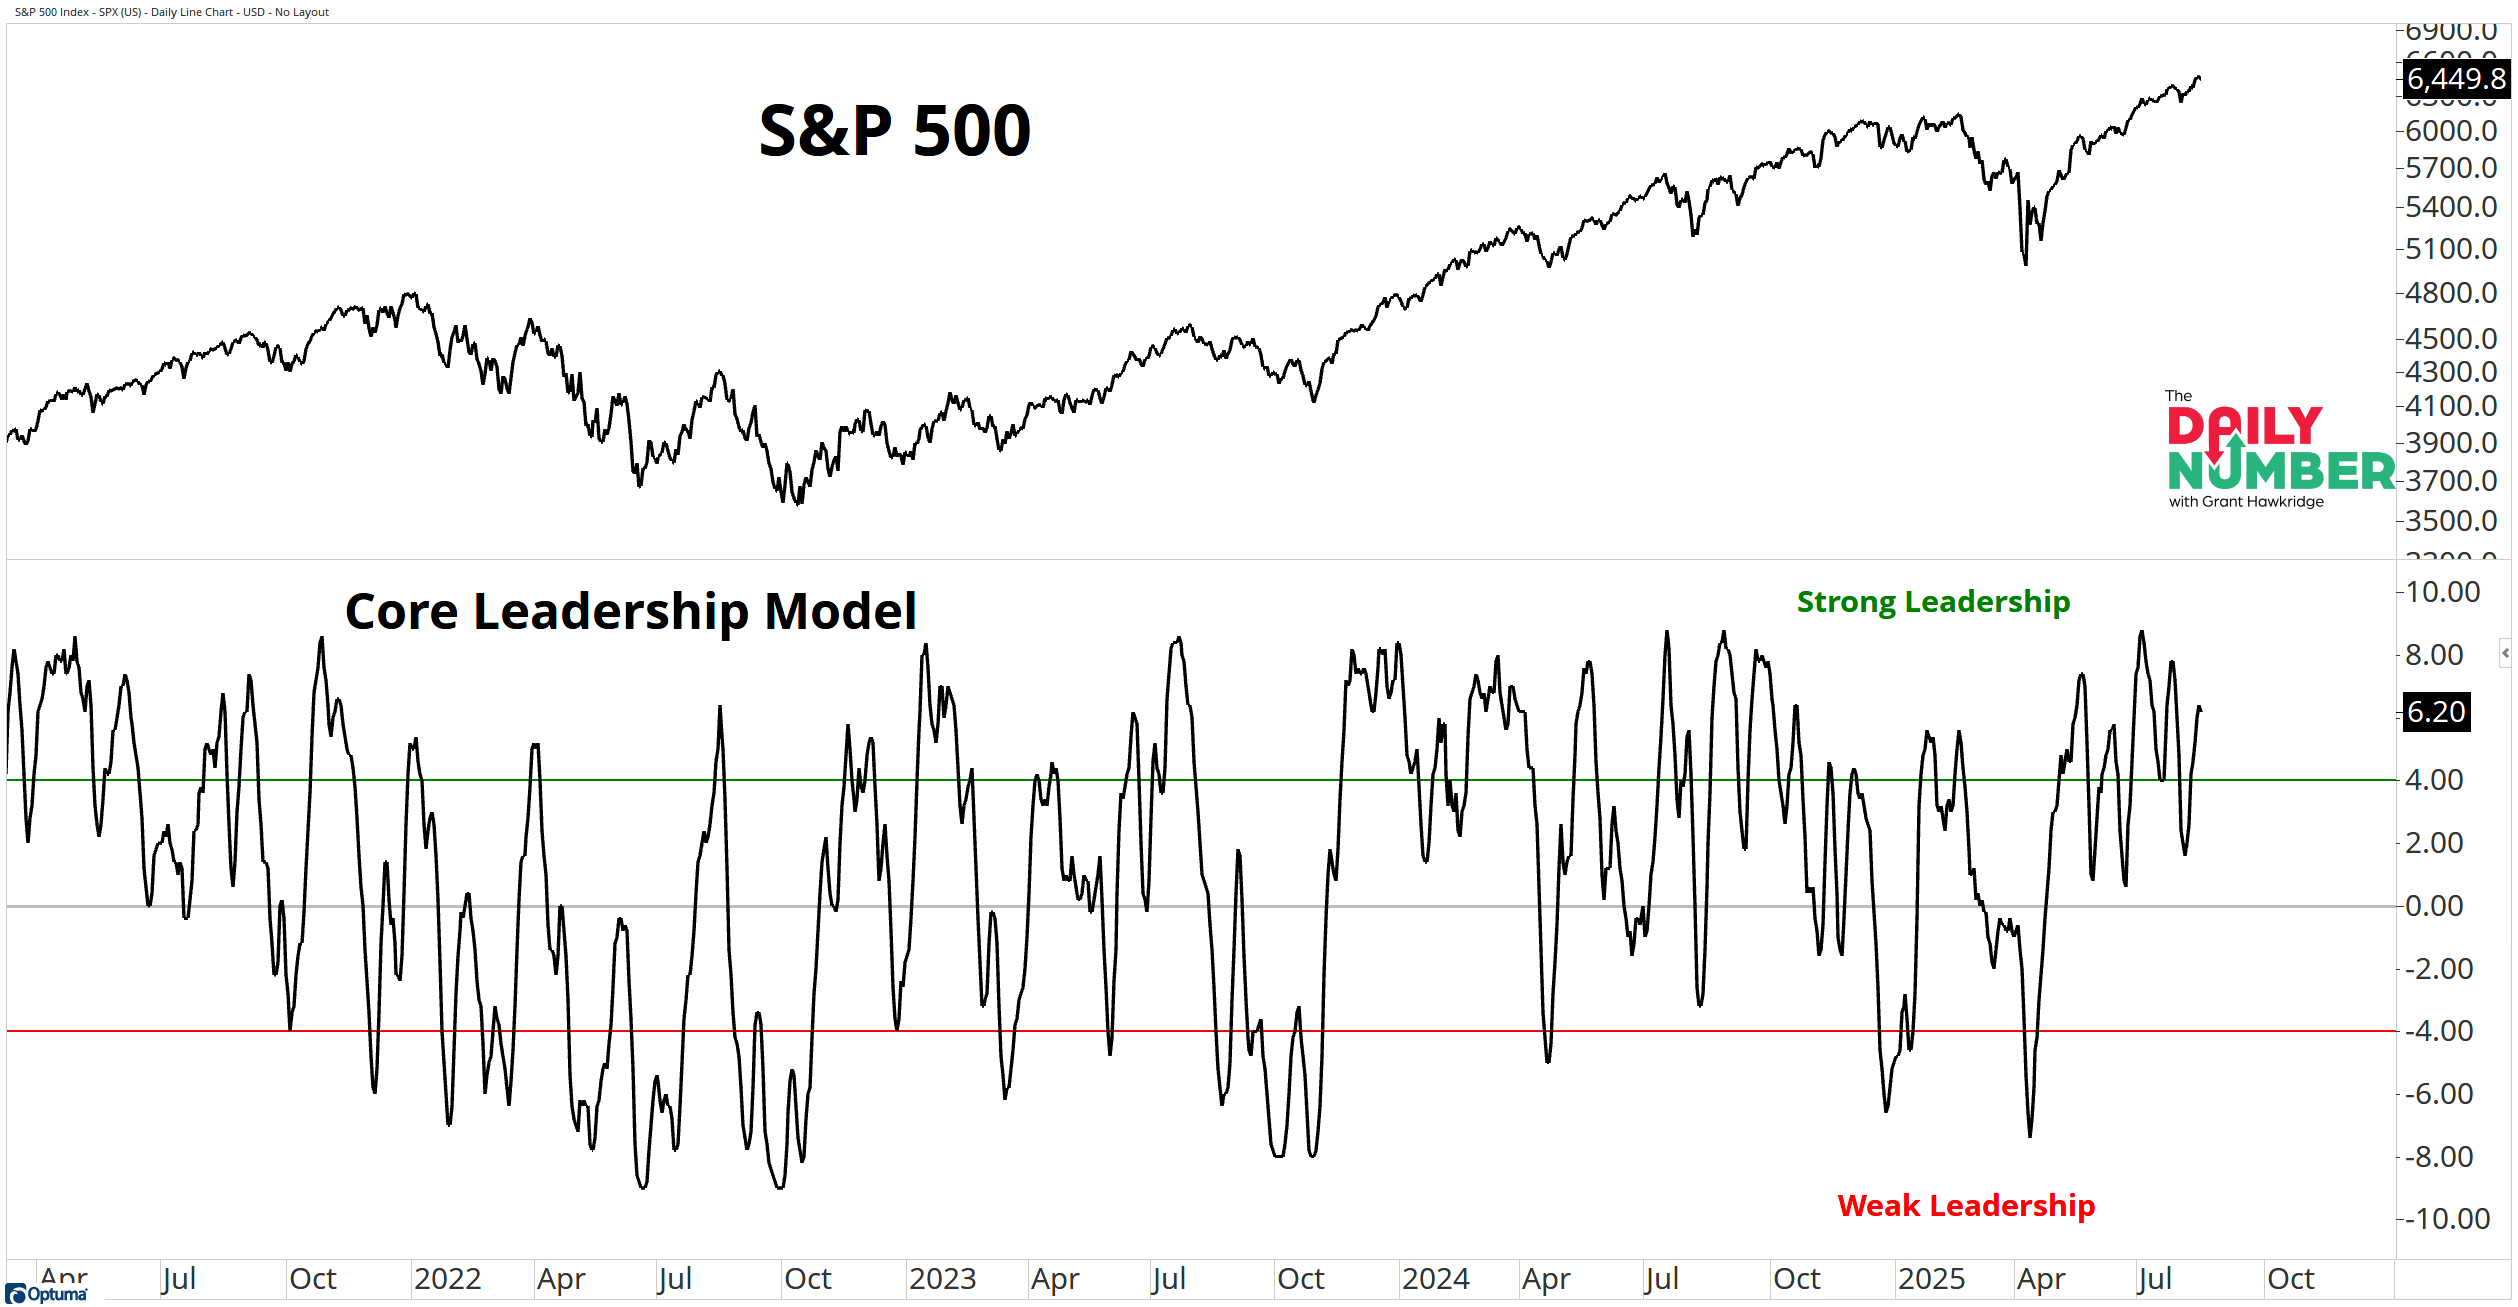
Let's break down what the chart shows:
The top panel plots the S&P 500 daily close in black.
The lower panel shows the Core Leadership Model (black line), which blends short-, intermediate-, and long-term breadth metrics.
Readings above +4 (green line) mark Strong Leadership. Readings below -5 (red line) mark Weak Leadership.
The Takeaway: Breadth is strong.
A 6.2 reading means leadership is broad and aligned not just in the US, but globally — and across short, intermediate, and long-term horizons.
That’s the kind of strong bull markets thrive on.
This matters because it shows the rally isn’t narrow or fragile.
Strength is spread across regions and timeframes, which makes the trend more durable.
When leadership breadth is this healthy, pullbacks are usually digestion — not regime change.
That’s why divergences don’t matter here.
They only become meaningful if the model breaks sharply below zero and stays there.
Right now, the signal is clear: participation is confirming strength, not questioning it.
When breadth is this strong across regions and timeframes, the market’s engine isn’t running on fumes — it’s running on full power. The path of least resistance is higher — so why fight the tape?
Grant Hawkridge | Chief Aussie Operator, All Star Charts
Need a full trading toolkit that actually helps you make moves? All Star Charts Premium gives you daily trade ideas, proprietary scans, and access to our entire analyst team. If you're serious about leveling up your strategy, start here.
If you find my content valuable, I would greatly appreciate it if you could share it with your friends, family, and colleagues. Your help in spreading the word is invaluable in supporting our work. Thank you to all of you who share!