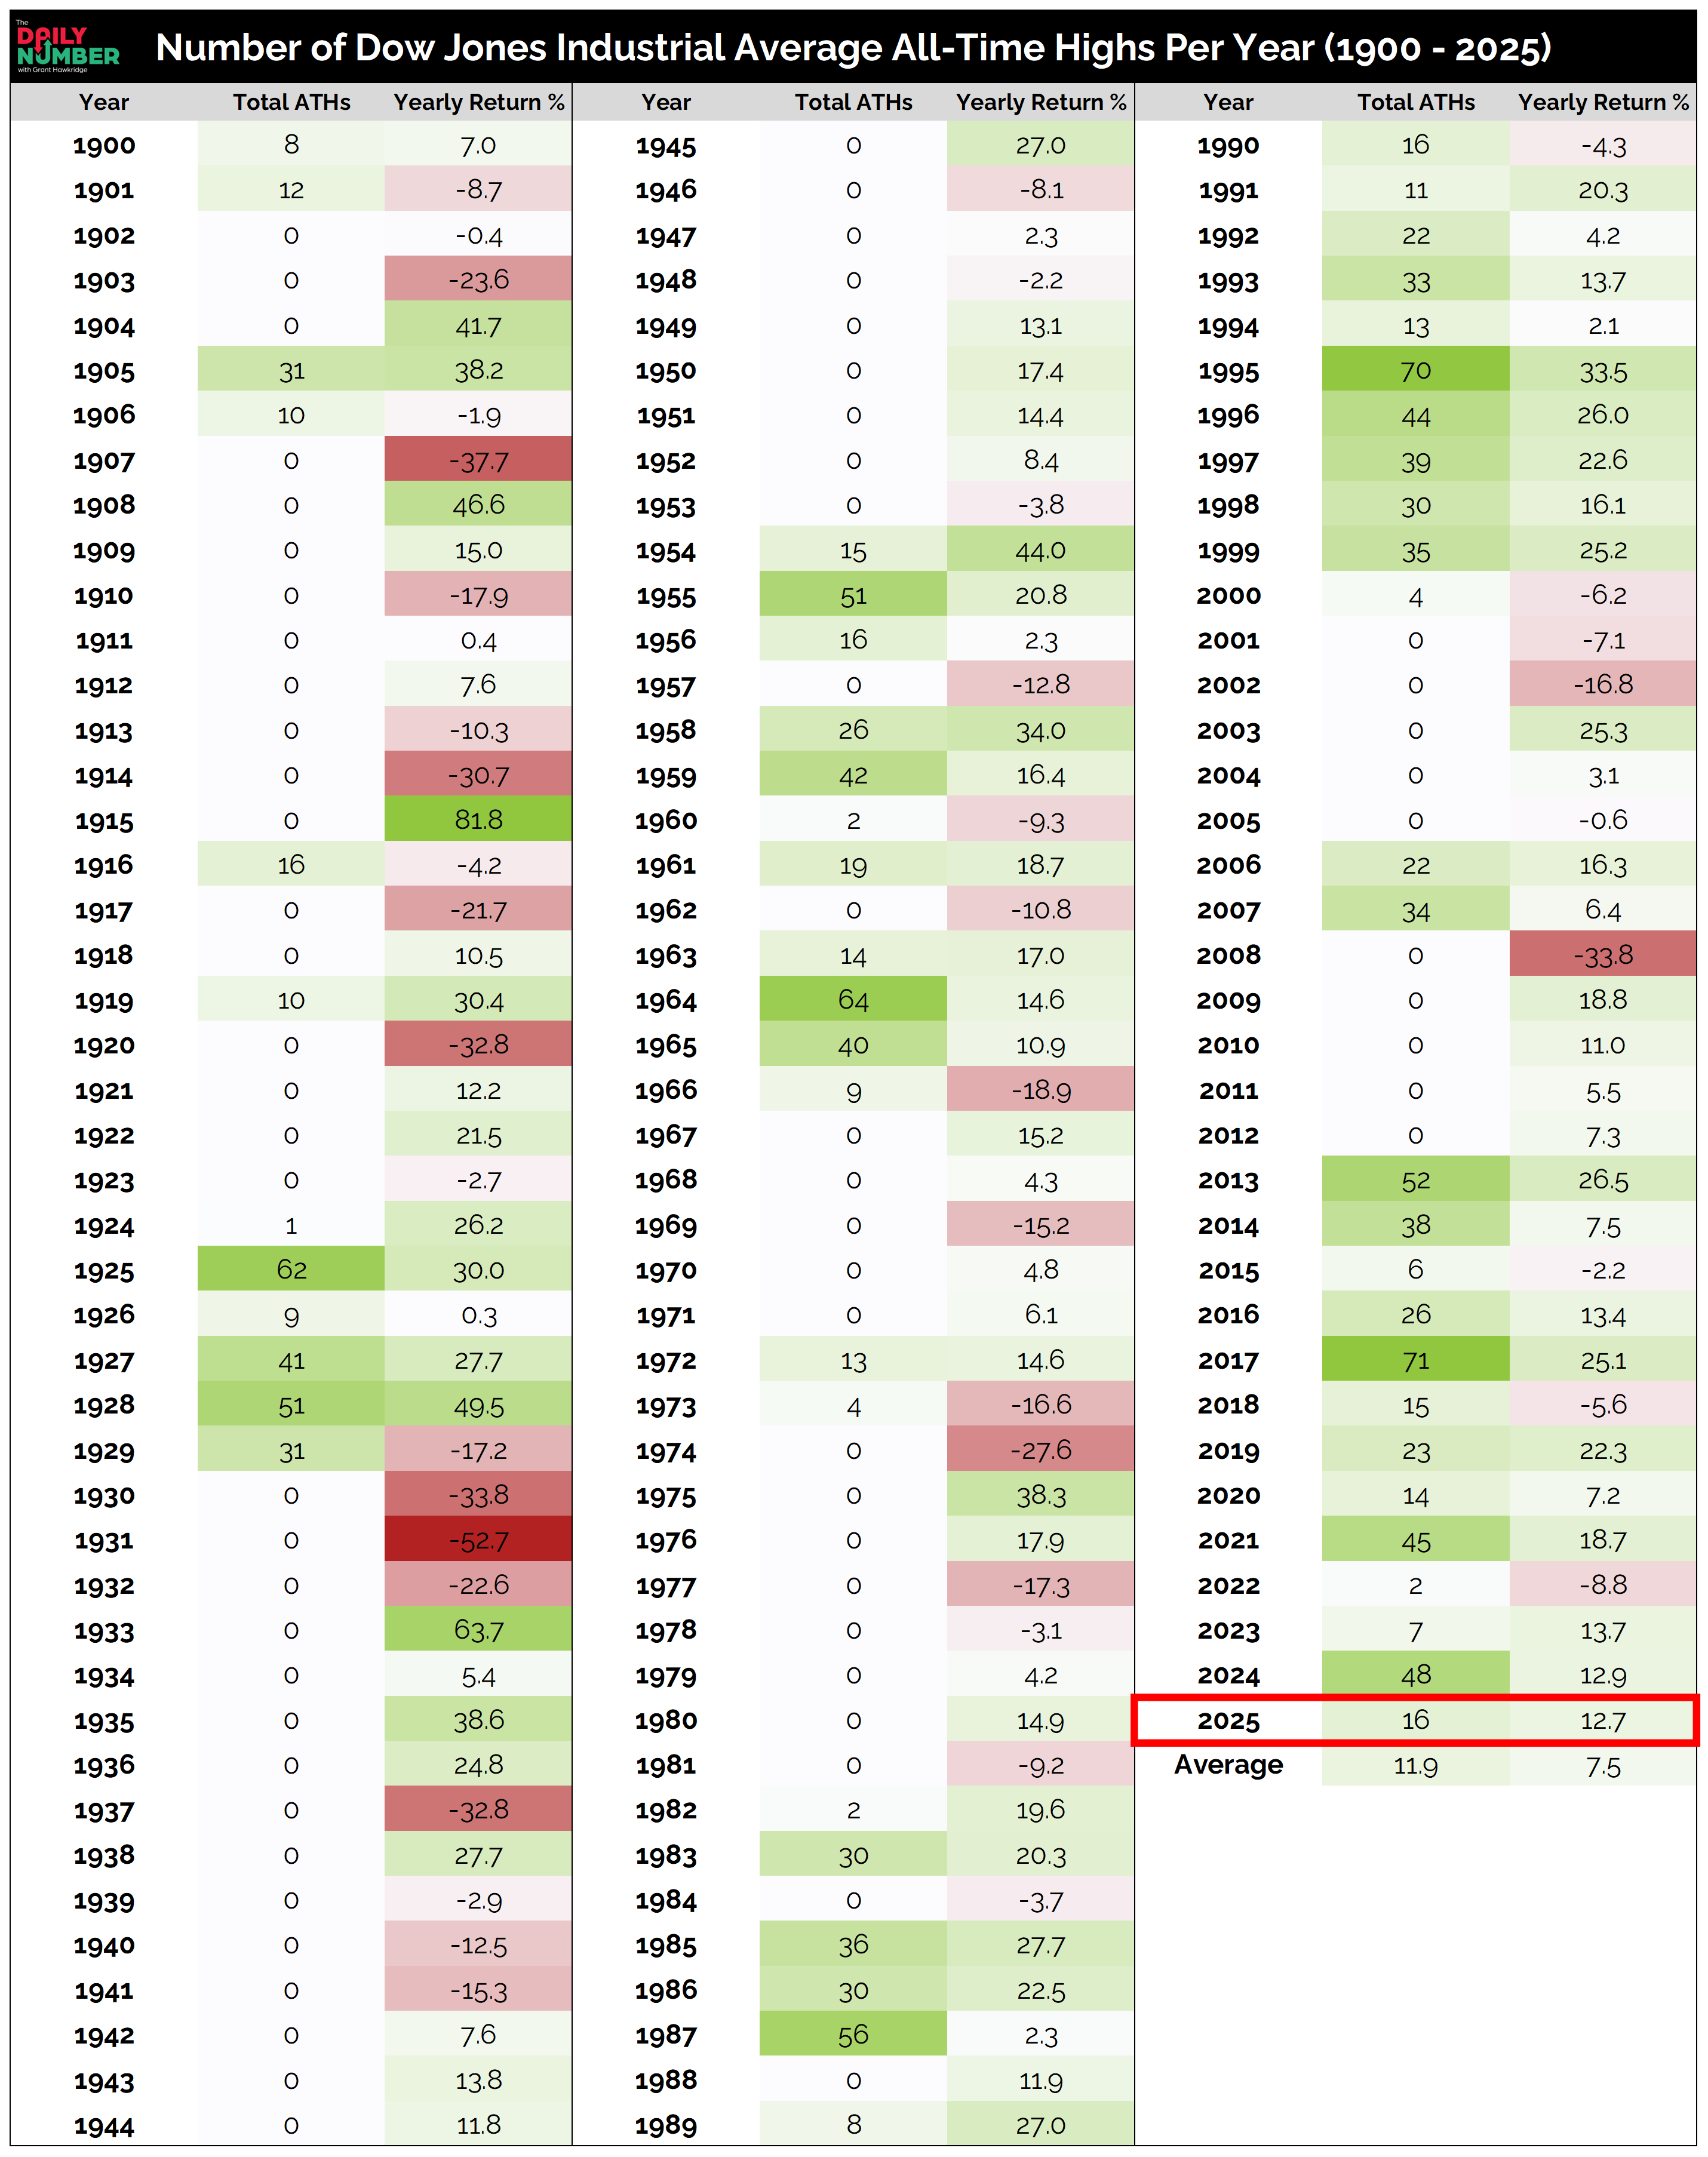
The Dow Jones Industrial Average has now hit 16 all-time highs in 2025. That’s already above the 125-year average of 12.
Here’s the table:
Let's break down what the table shows:
The table lists the Dow Jones Industrial Average's all-time highs by year from 1900 to 2025. Each row shows the total number of all-time highs and the yearly return in %.
The Takeaway: Nothing says bull market like new highs.
This year’s 16 puts 2025 well above average and in line with other strong advance years.
When the Dow records 15 or more highs in a year, the average return has been around 17%. That is more than double the long-term average of 7.5%.
Momentum like this only appears during healthy, trending markets. It shows investors are leaning in, not backing away. That is the behavior that fuels lasting bull markets.
The red zones across history from the 1930s to the 1950s, 1970s, and early 2000s tell the other side. Those were the years when new highs vanished and bear markets took hold.
All-time highs are not the end of a trend.
They are proof of demand and participation.
All-time highs do not end bull markets. They build them.
If you find my content valuable, I would greatly appreciate it if you could share it with your friends, family, and colleagues. Your help in spreading the word is invaluable in supporting our work. Thank you to all of you who share!