All major indices are above every key moving average, from 5-day to 200-day.
Here’s the chart:
Let's break down what the chart shows:
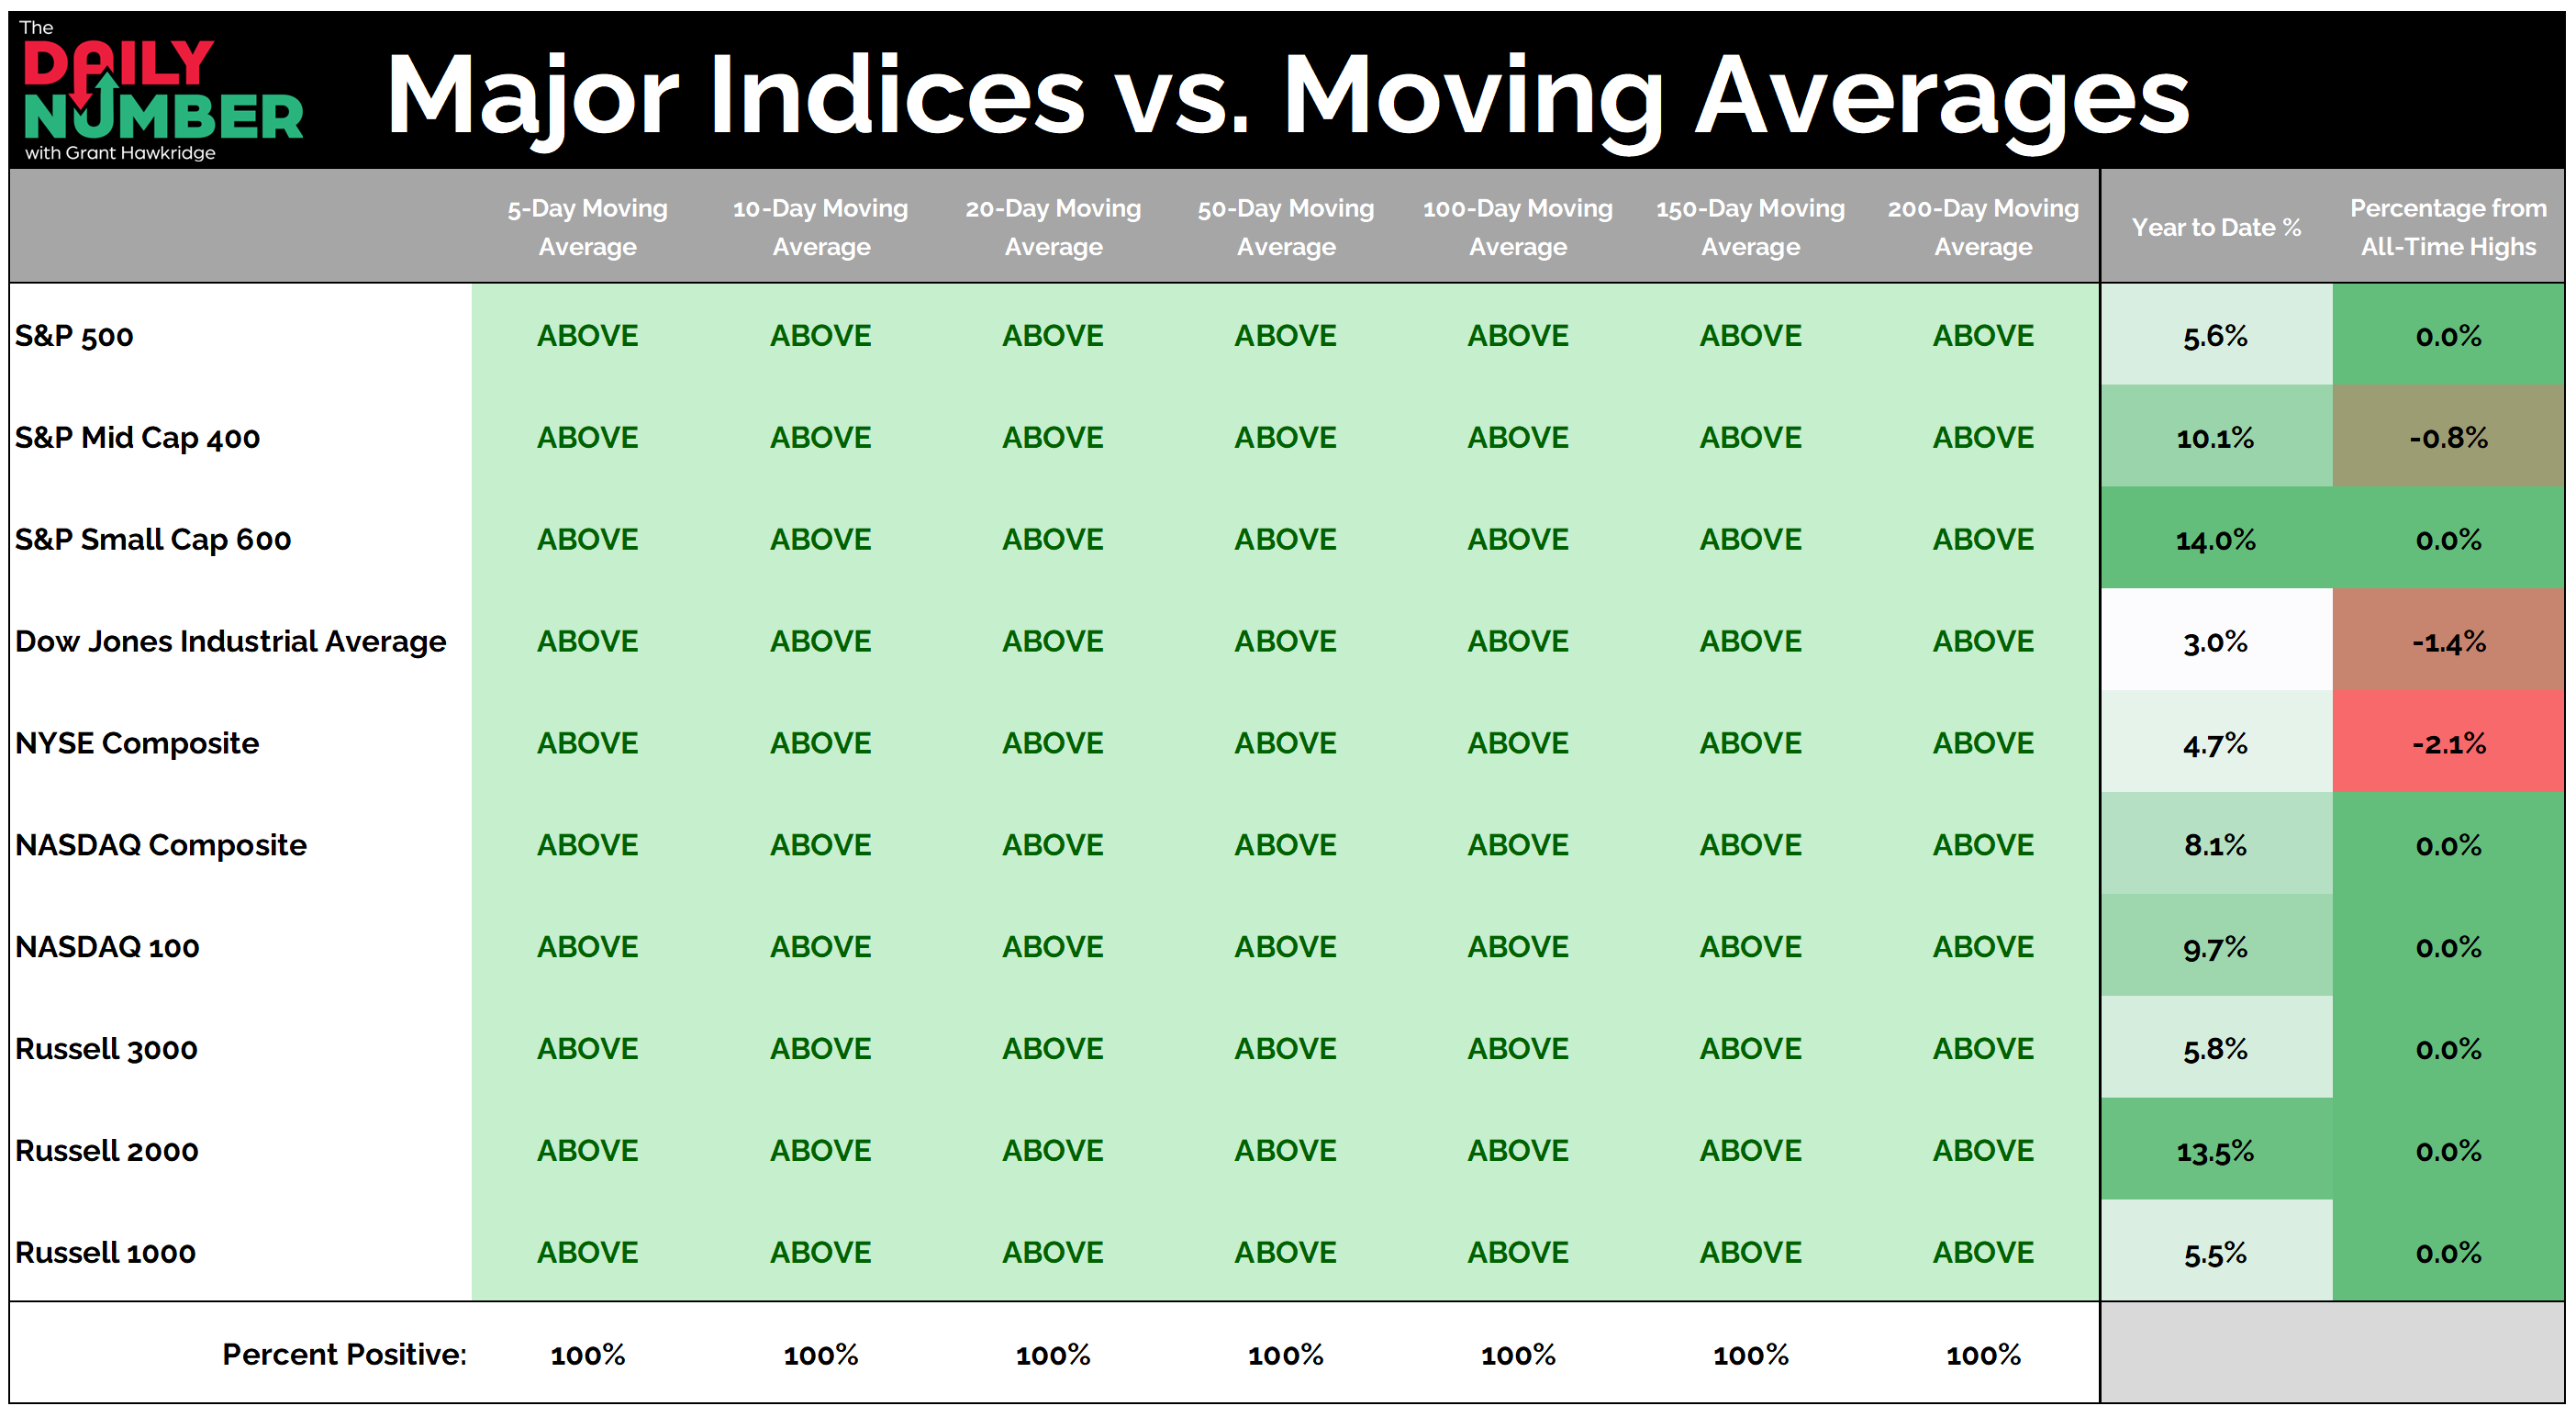
The table lists ten major US stock indexes in rows.
The columns list seven moving averages: 5-day, 10-day, 20-day, 50-day, 100-day, 150-day, and 200-day.
Each cell displays “Above” in green when the index is trading above the moving average and “Below” in red when it is trading below it.
Two additional columns show Year-to-Date performance and the percentage distance from all-time highs.
The Takeaway: 100% of the major indices I track daily are above every key moving average, from 5-day through 200-day. This tells me that everything is in an established uptrend, and there are no trend cracks showing up anywhere right now.
Every timeframe is pushing in the same direction, and that keeps steady pressure on the upside. When short-term and long-term trends move together like this, dips don’t get much room because buyers keep stepping in.
The strength is not isolated. Large caps, mid caps, and small caps are all trending higher together. When everything is moving, the overall market trend has a lot more support behind it and becomes harder to slow down.
You can see that clearly in the returns. Small caps are leading with the S&P 600 up 14% and the Russell 2000 up over 13%, while mid caps are also strong at over 10%. Large caps are lagging a bit, but they are still positive and still trending higher.
At the same time, growth names have not rolled over. The Nasdaq 100 is up 9.7%, and the NASDAQ Composite is up 8.1%, so tech is still contributing while broader participation expands around it.
When you zoom out, most of these indices are sitting right at all-time highs or within 2% of them. That means there is no real overhead supply to work through.
The markets are accepting higher prices and continuing to trade there.
This kind of trend setup does not leave much room for a bearish case right now.
The path is clearly still higher, and right now the only real risk is how stretched things can get in the short term. But stretched in an uptrend is very different from a downtrend. Bulls can stay bullish longer than bears can stay bearish, and right now the bulls are in control.
Grant Hawkridge | Chief Aussie Operator, All Star Charts
Every day, Spencer sits across from some of the smartest analysts in the business and listens to their best trade ideas. Long-term core positions, swing trades from the analyst network, and a monthly options play. One year, $199.