Just 46.3% of S&P 500 stocks are outperforming the index as we approach the halfway point of 2026.
Here’s the chart:
Let's break down what the chart shows:
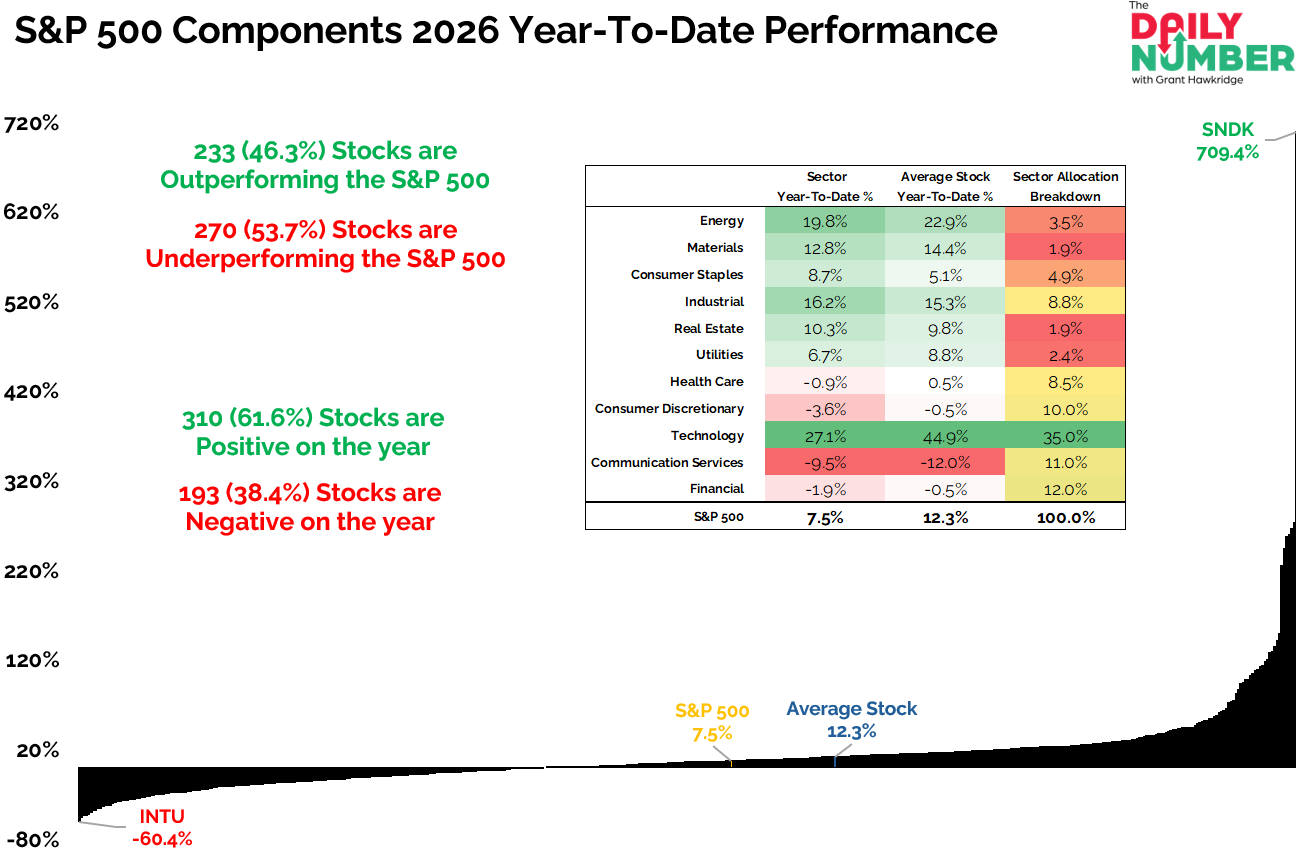
The chart ranks every S&P 500 stock by its 2026 year-to-date return from lowest to highest.
A first set of text labels shows that 233 stocks, or 46.3%, are outperforming the S&P 500, while 270 stocks, or 53.7%, are underperforming it.
A second set of text labels shows that 310 stocks, or 61.6%, have positive returns for the year, while 193 stocks, or 38.4%, are negative.
A table compares each sector's year-to-date return, the average return of its individual stocks, and its weighting in the S&P 500.
TheTakeaway: We're almost halfway through 2026, and one thing stands out. Making money and beating the market haven't been the same thing.
61.6% of S&P 500 stocks are higher this year, yet only 46.3% are outperforming the index. Plenty of stocks have delivered positive returns, but many have simply risen less than the S&P 500. Owning a winner has not automatically meant outperforming the benchmark.
The average S&P 500 stock is up 12.3%, comfortably ahead of the index's 7.5% return. At the same time, one stock has gained more than 700% this year, while another has lost more than 60%. The gap between the winners and losers has remained wide, creating plenty of opportunities for investors who found the market's leaders.
This hasn't been a market where every stock shared the same fate. Leadership has broadened, but the biggest winners have continued to pull away from the rest of the market. Stock selection has made the difference. That has rewarded investors who focused on where money was flowing instead of simply owning the average stock.
The first half of 2026 hasn't been about whether you were invested. It's been about what you were invested in.
The second half may come down to something simpler: whether this becomes a market where more stocks catch up, or one where the gap between the leaders and everyone else keeps widening.
Grant Hawkridge | Chief Aussie Operator, All Star Charts
Spencer Israel sits across from the entire analyst network every day, hears more good ideas than any one person could ever trade, and picks the ones he likes most.
The SMTV Portfolio is what happens when he puts $10K of his own money behind those calls.