The current S&P 500 bull market is now up 102.9% from the October 2022 low.
Here’s the chart:
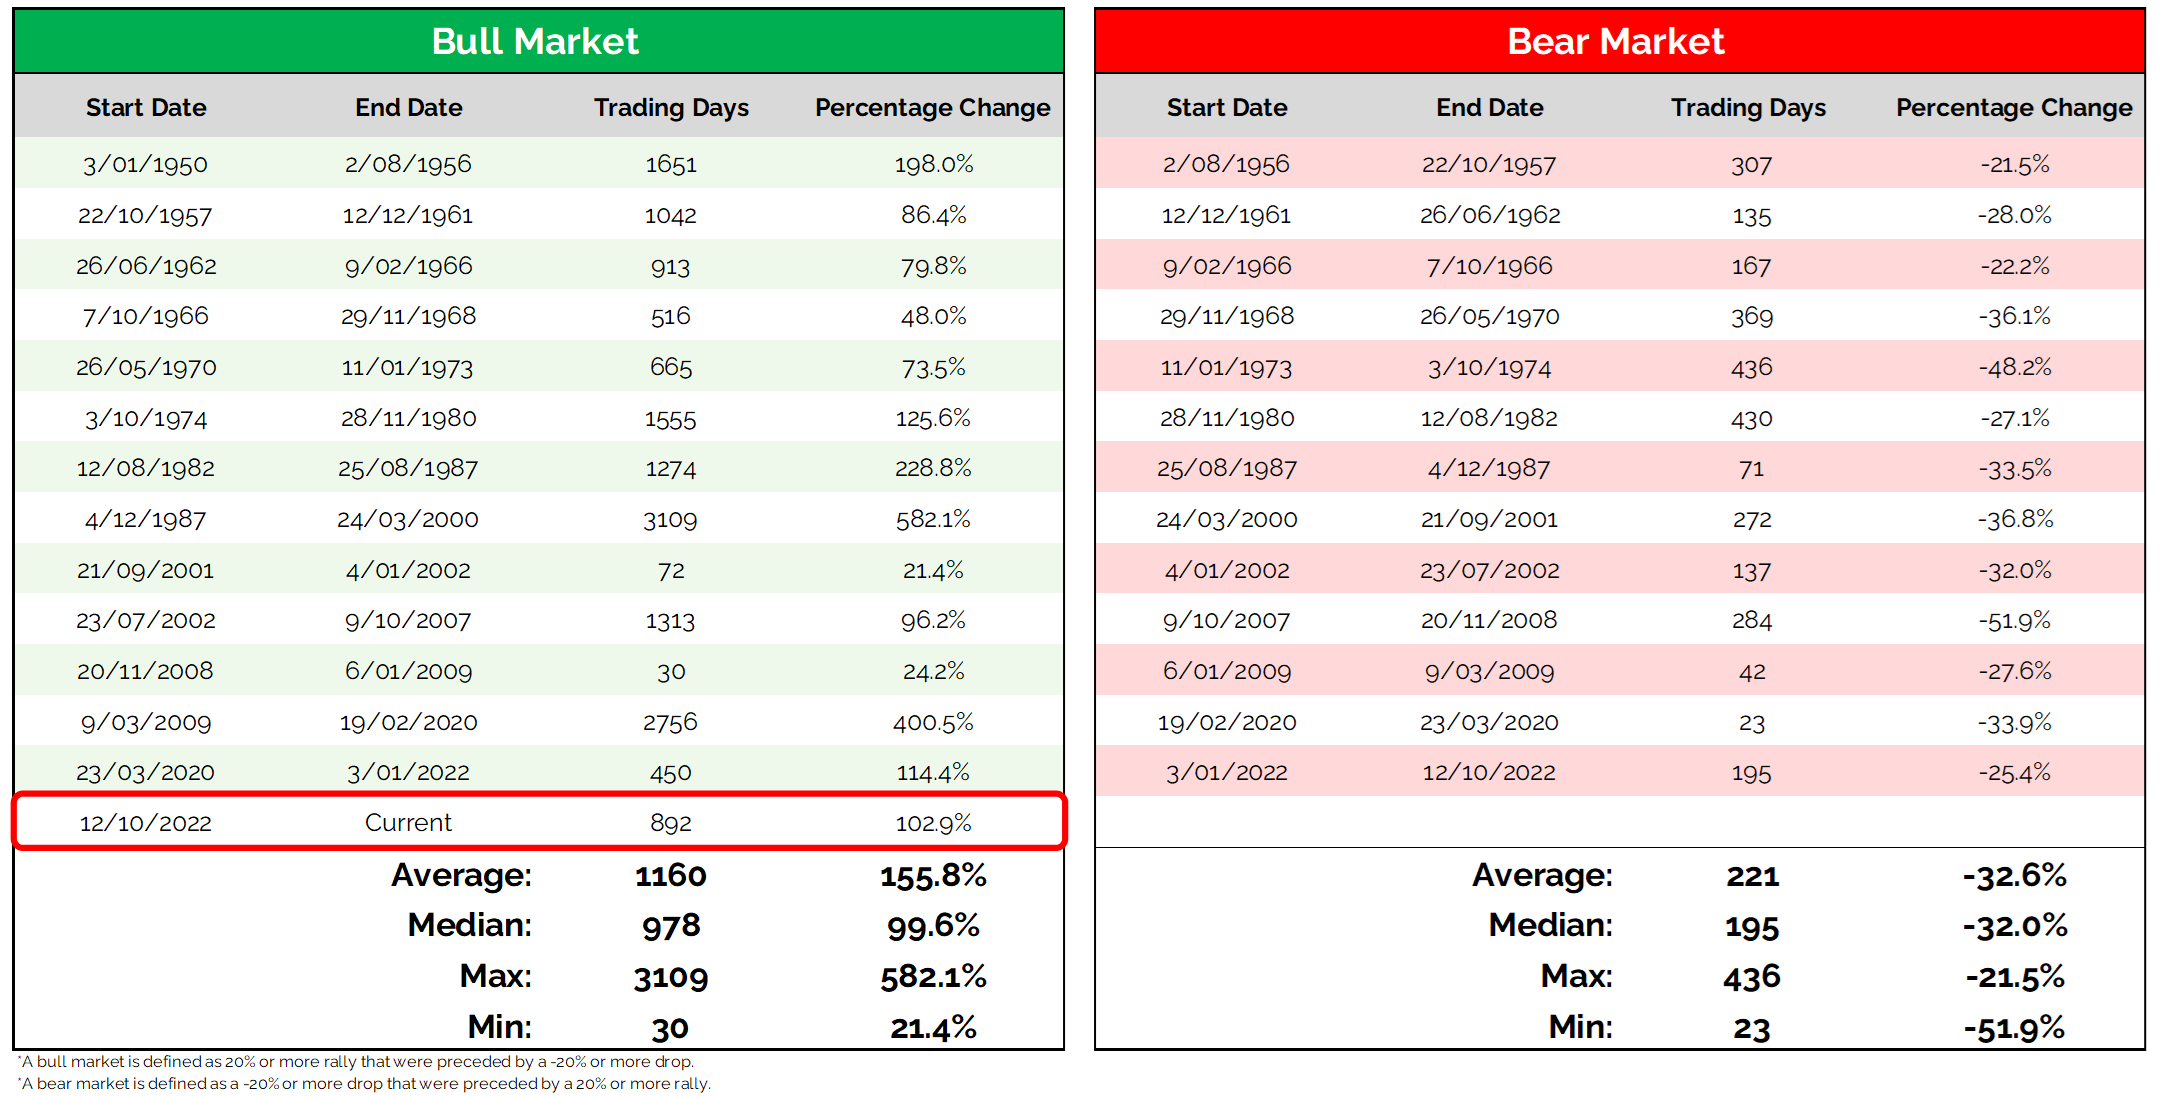
Let's break down what the chart shows:
The chart shows two tables tracking historical bull and bear markets in the S&P 500 since 1950.
The left table is shaded green and lists each bull market with its start date, end date, trading days, and percentage gain.
The right table is shaded red and lists each bear market with its start date, end date, trading days, and percentage decline.
Both tables include summary statistics at the bottom for average, median, maximum, and minimum trading days and percentage changes.
A bull market is defined as a 20% or more rally that was preceded by a -20% or more drop. A bear market is defined as a 20% or more drop that was preceded by a 20% or more rally.
TheTakeaway: The S&P 500 just closed at another all-time high.
That was the 13th all-time high already printed in 2026.
Markets do not keep making fresh highs like this when sellers are in control. Bull markets spend their time pushing into new highs, not hiding below them.
The current bull market is now up 102.9% from the October 2022 low. The move has officially doubled. Yet from a time perspective, this run is not historically stretched. The current cycle has lasted 892 trading days, still below the historical bull market average of 1160 trading days.
This rally has already outperformed several multi-year bull markets from history. The 1957 to 1961 cycle gained 86%. The 1962 to 1966 advance returned 79%. The 2002 to 2007 bull market climbed 96%. The current run has now cleared all of them.
Only six bull markets since 1950 have produced larger gains than today’s move. So, this puts the current cycle in the upper tier.
And this move did not happen in a clean backdrop. This bull market climbed through recession calls, Fed hikes, inflation fears, regional bank stress, and nonstop macro panic. But price kept trending higher anyway.
So, for me, the takeaway is simple: this market keeps rewarding investors who stay with the trend instead of trying to predict the top. Price keeps making new highs, and until that changes, I would rather listen to the market than the fear around it.
Grant Hawkridge | Chief Aussie Operator, All Star Charts
Every day, Spencer sits across from some of the smartest analysts in the business and listens to their best trade ideas. Long-term core positions, swing trades from the analyst network, and a monthly options play. One year, $199.