Everyone Keeps Calling for Weakness. But Breadth Keeps Expanding 📊
By Grant Hawkridge
May 8, 2026
Today's number is... 22
Stocks have now posted 22 straight trading days with more new highs than new lows, even as investors keep waiting for this rally to break down.
Here’s the chart:
Let's break down what the chart shows:
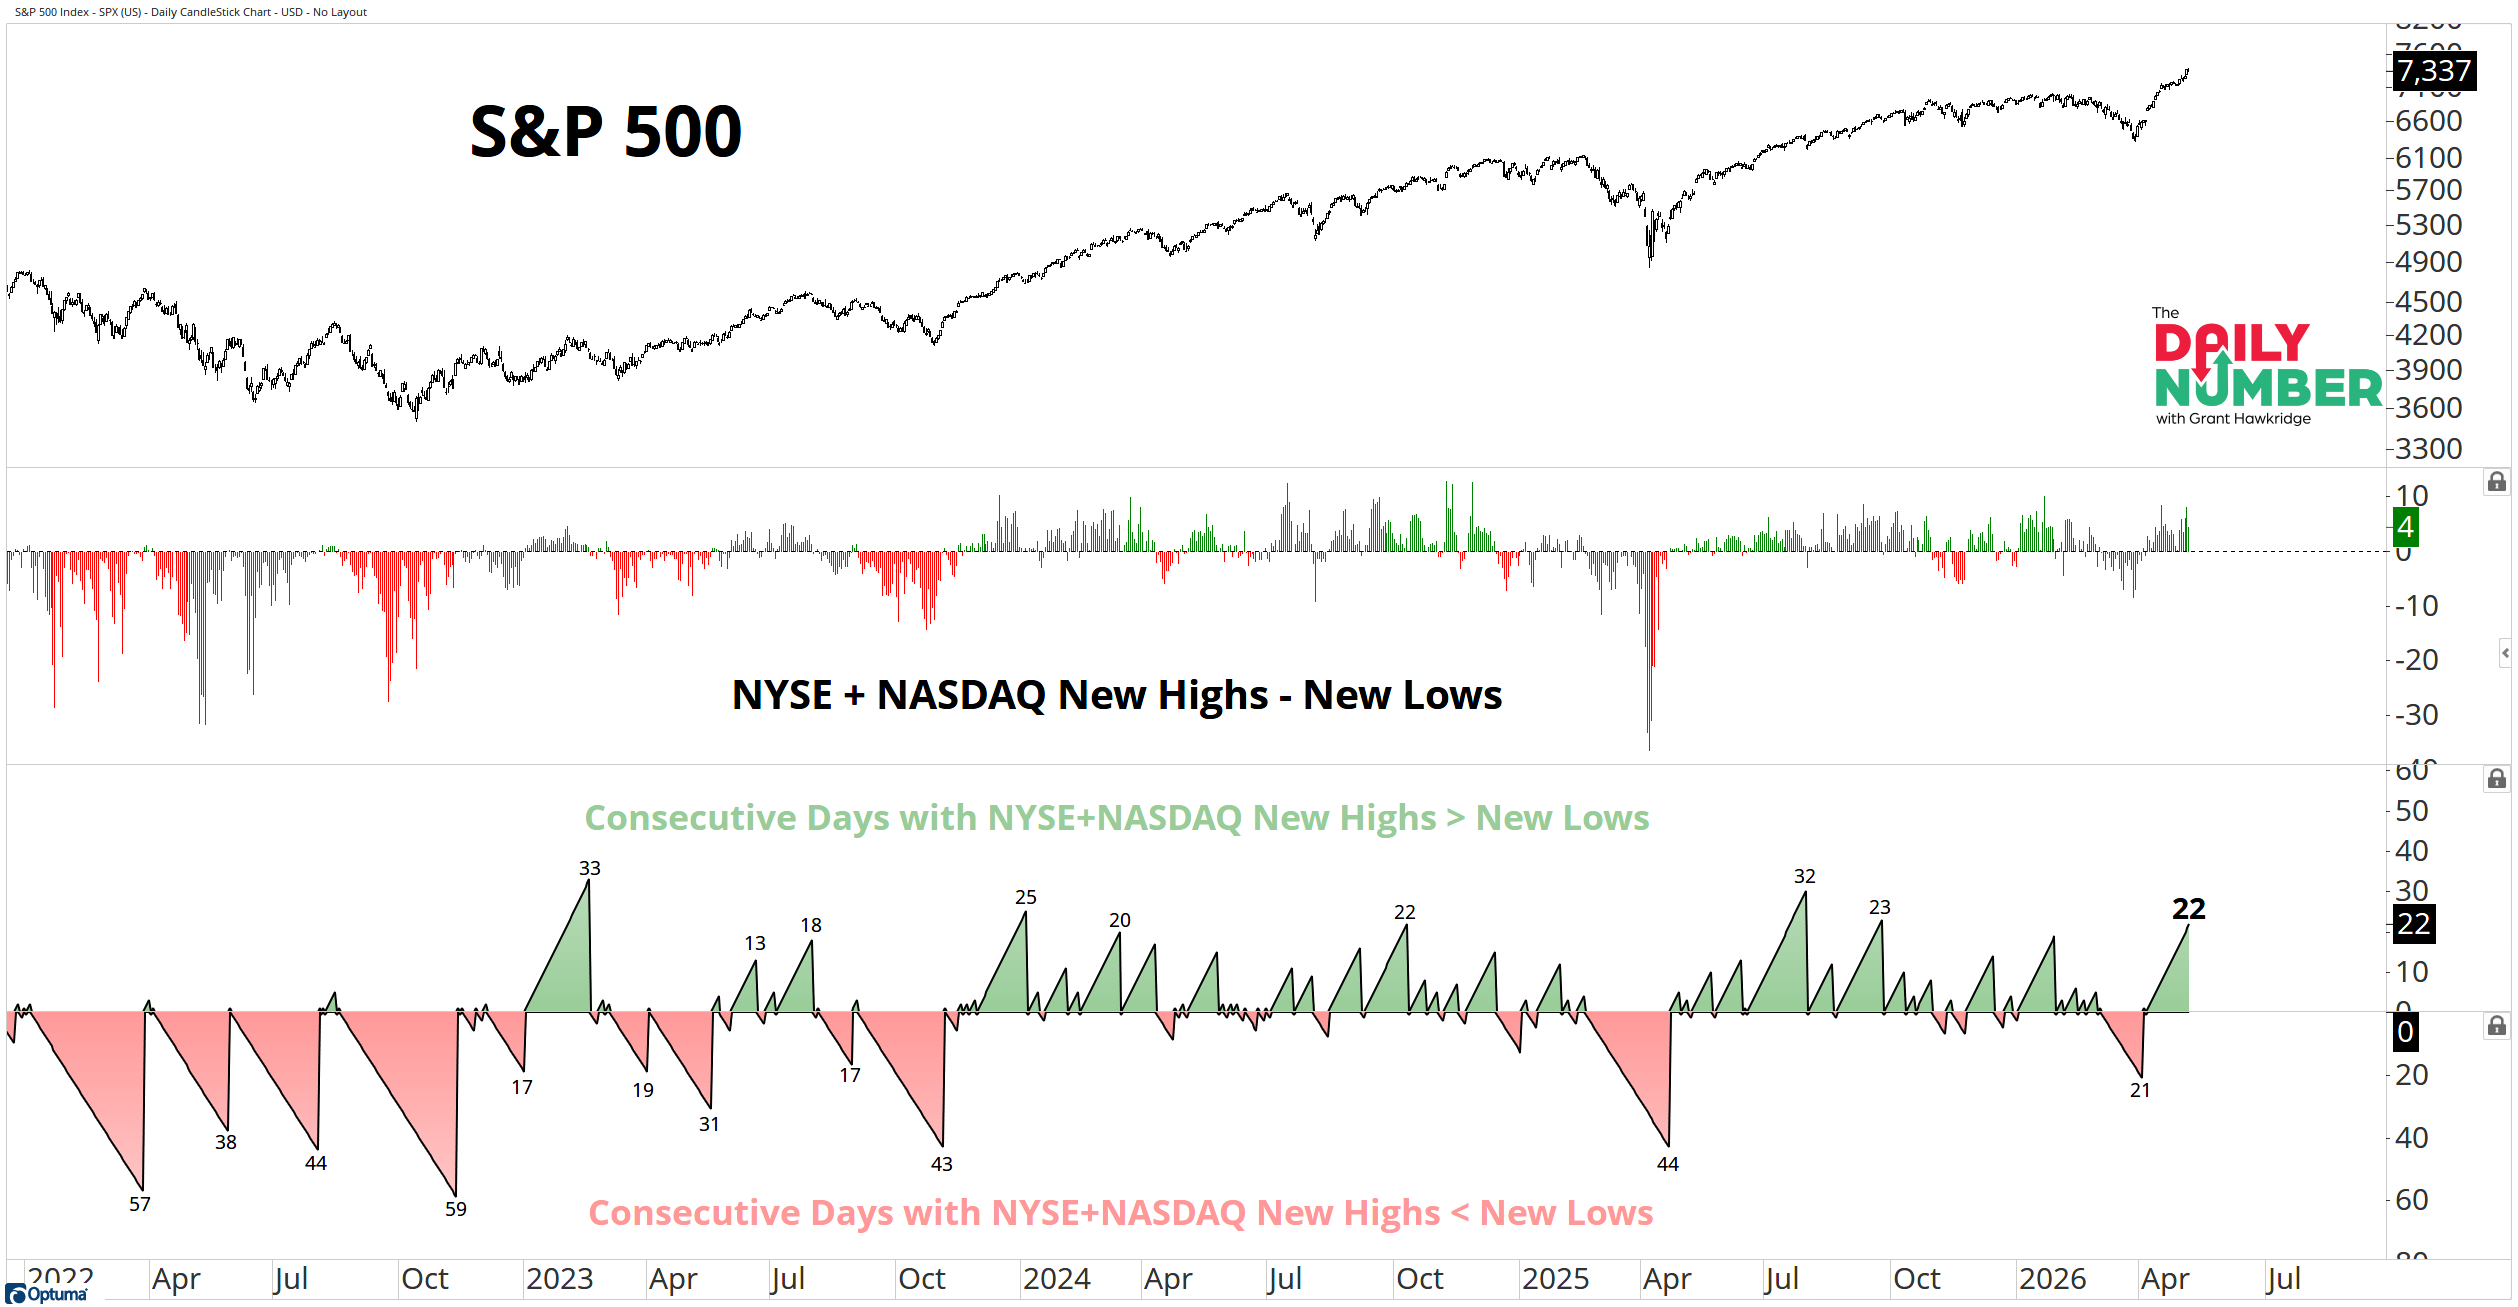
The top panel displays the S&P 500 in black.
The middle section displays daily NYSE and NASDAQ new highs minus new lows using green and red histogram bars.
The bottom section displays consecutive trading day streaks where new highs were greater than new lows in green, and streaks where new lows were greater than new highs are in red.
TheTakeaway: Strong markets keep producing new highs. And that is exactly what stocks keep doing right now.
Stocks have now gone 22 straight trading days with more new highs than new lows across the NYSE and NASDAQ combined. That is the longest positive streak since September 2025.
The market has dealt with nonstop macro noise all year, and constant pullback predictions have not stopped stocks from continuing to push higher underneath the surface.
That is what strong bull markets do.
More stocks start participating. Leadership broadens out, and money keeps rotating into new areas of the market instead of hiding on the sidelines.
And this is happening while the S&P 500 index is trading right near its all-time highs. A lot of people want to frame this as a narrow rally driven by a handful of stocks. But streaks like this usually happen when strength is spreading across the market, not shrinking into fewer names.
The longer stocks keep producing new highs across the market, the clearer it becomes that buyers are still controlling the trend.
Grant Hawkridge | Chief Aussie Operator, All Star Charts
Every day, Spencer sits across from some of the smartest analysts in the business and listens to their best trade ideas. Long-term core positions, swing trades from the analyst network, and a monthly options play. One year, $199.