One Streak Just Broke… And I’m Watching Closely 👁️
By Grant Hawkridge
May 13, 2026
Today's number is... 27
A quiet shift just hit market internals. More NYSE stocks hit new lows than new highs for the first time in 27 trading days.
Here’s the chart:
Let's break down what the chart shows:
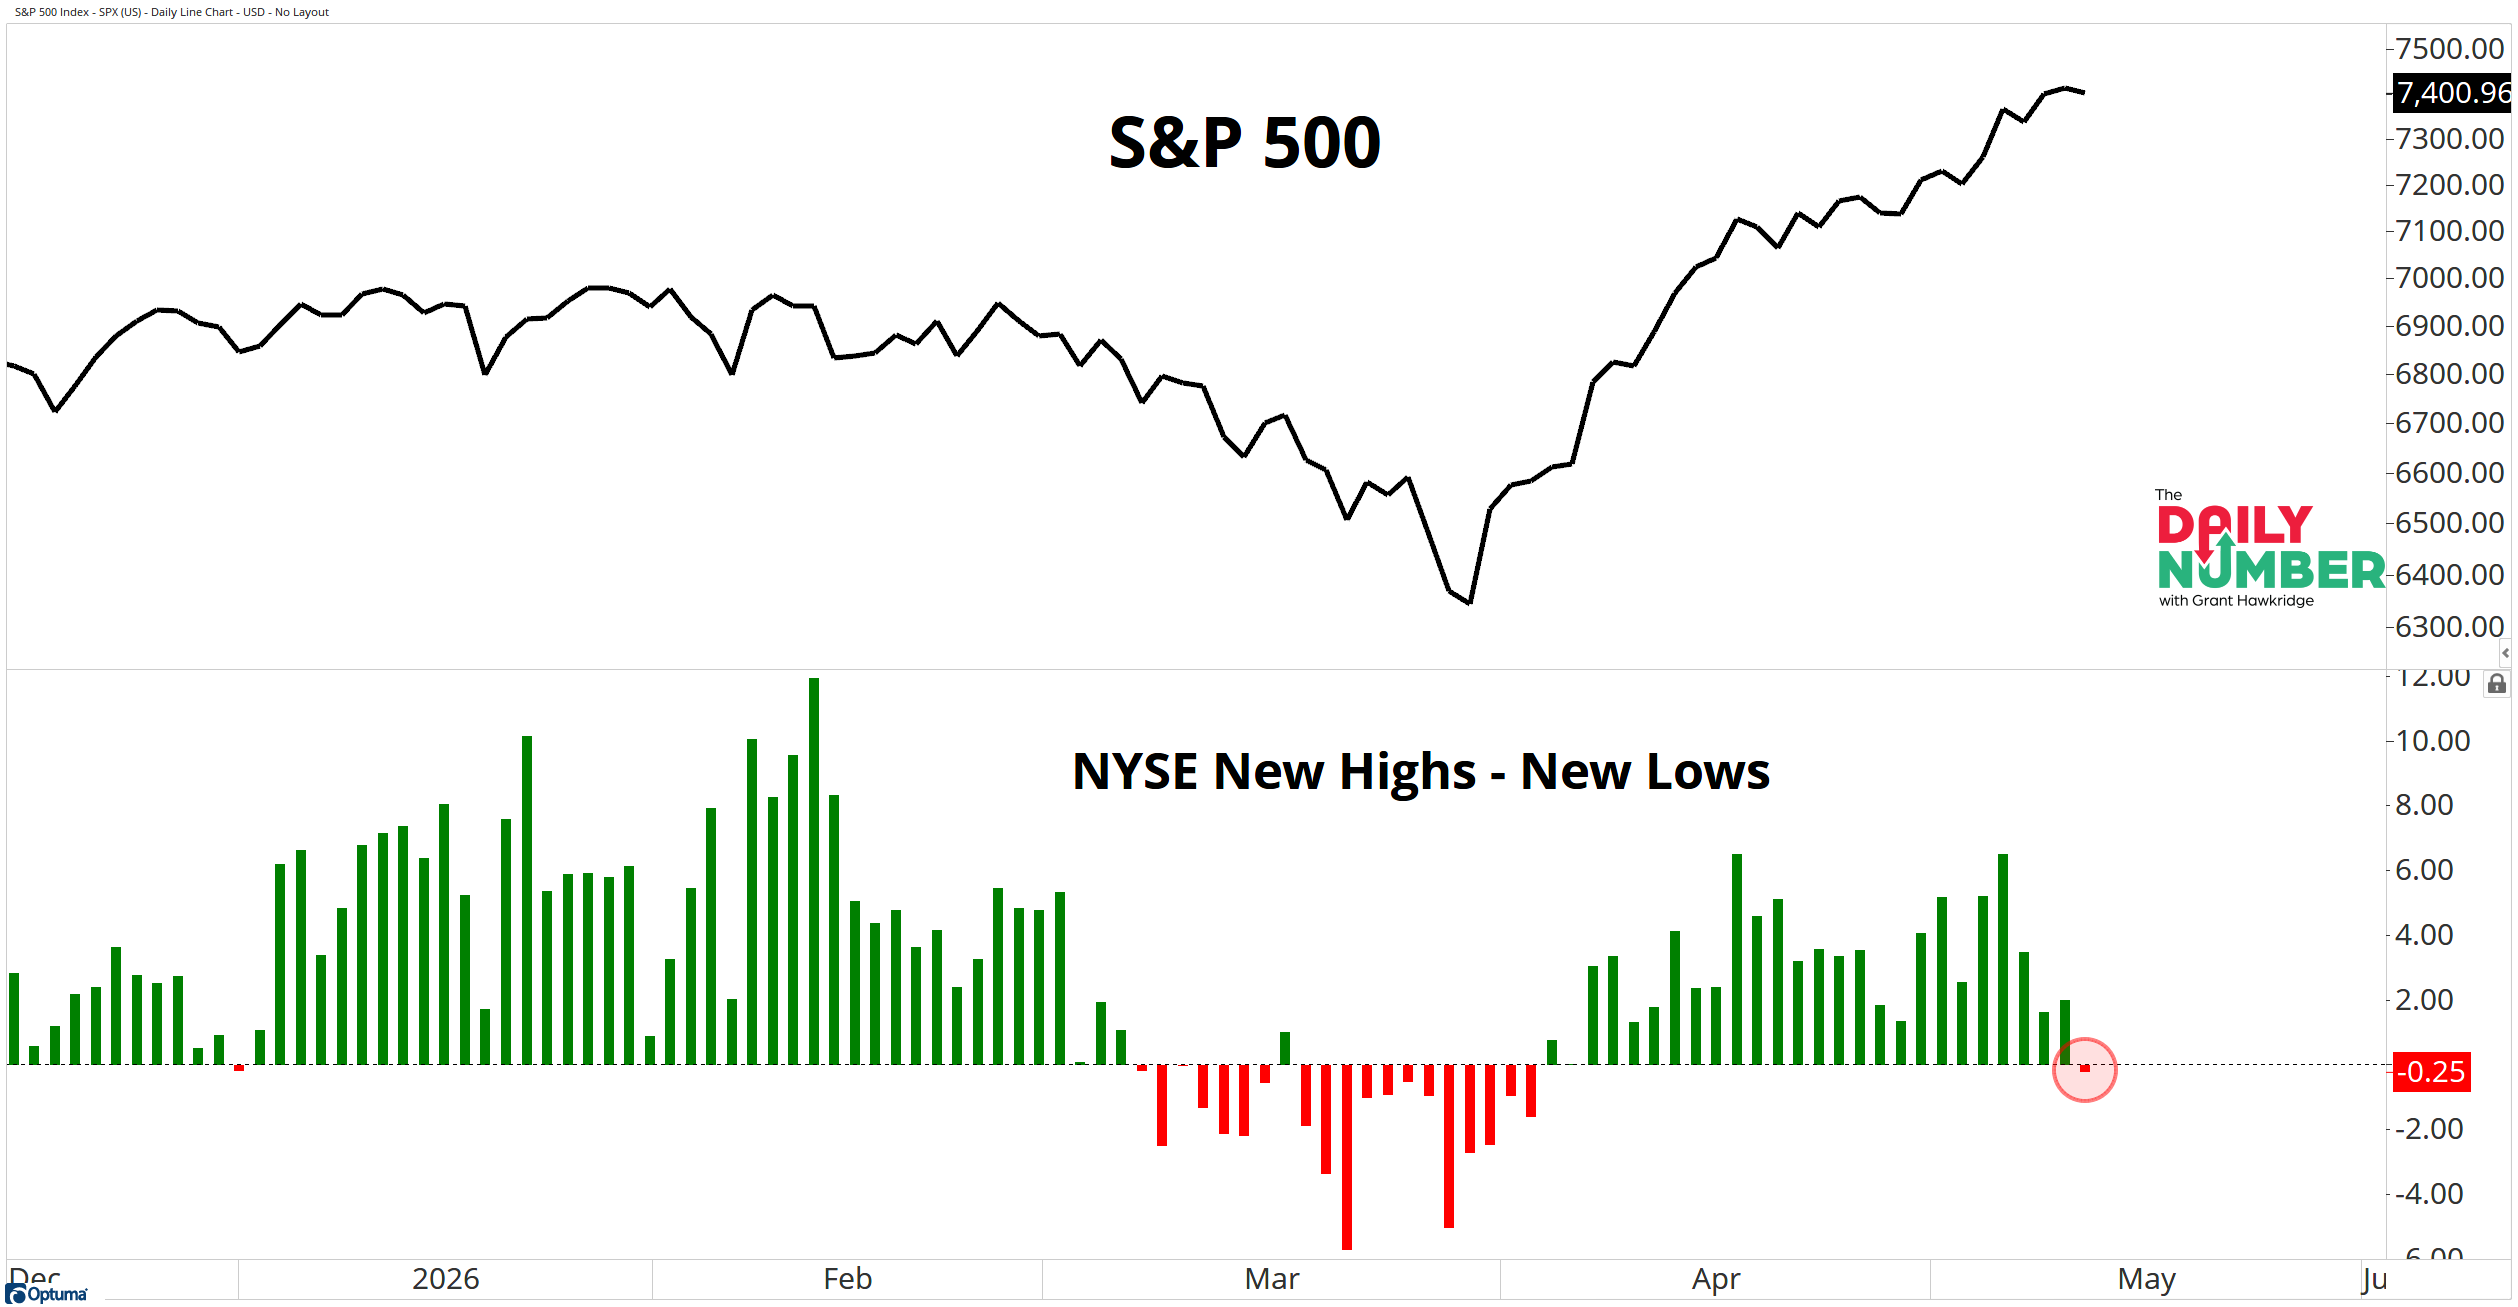
The top panel shows the S&P 500 in black.
The bottom panel displays NYSE new highs minus new lows
Green bars represent periods where new highs exceeded new lows.
Red bars represent periods where new lows exceeded new highs.
The latest reading is below zero and is highlighted with a red circle.
The Takeaway: The S&P 500 is still sitting near all-time highs.
The primary trend still points higher.
But something underneath the surface just changed.
For the first time in 27 trading days, more NYSE stocks made new lows than new highs. That streak mattered because strong bull markets normally keep producing more winners than losers underneath the surface. That was one of the biggest reasons this rally kept working.
Now we finally have a small crack in that behavior.
And right now, it is still small. The reading only slipped slightly below zero. One negative breadth reading during a strong advance is normal. Markets pause. Trends cool off and leadership rotates.
But this becomes a bigger issue if the red bars start stacking up from here.
If new lows continue expanding, the market starts losing participation underneath the surface. That is when rallies become narrower and eventually price starts feeling that pressure too.
So the market is sitting at an important fork in the road now.
Either breadth quickly recovers and new highs take back control, or this becomes the first warning sign that participation is starting to weaken beneath the index level.
The next few sessions probably matter more than today’s reading itself. The clock’s now ticking for breadth to choose a side.
Grant Hawkridge | Chief Aussie Operator, All Star Charts
Steve Strazza is hosting a free live training on Monday, May 18th at 4:30 PM ET.
The Fast Money Masterclass. He's walking through the proprietary indicator behind 14 doubles in 20 trades last month, and the simple strategy any investor can use to find trades that could 3x, 5x, even 10x in just a few days.