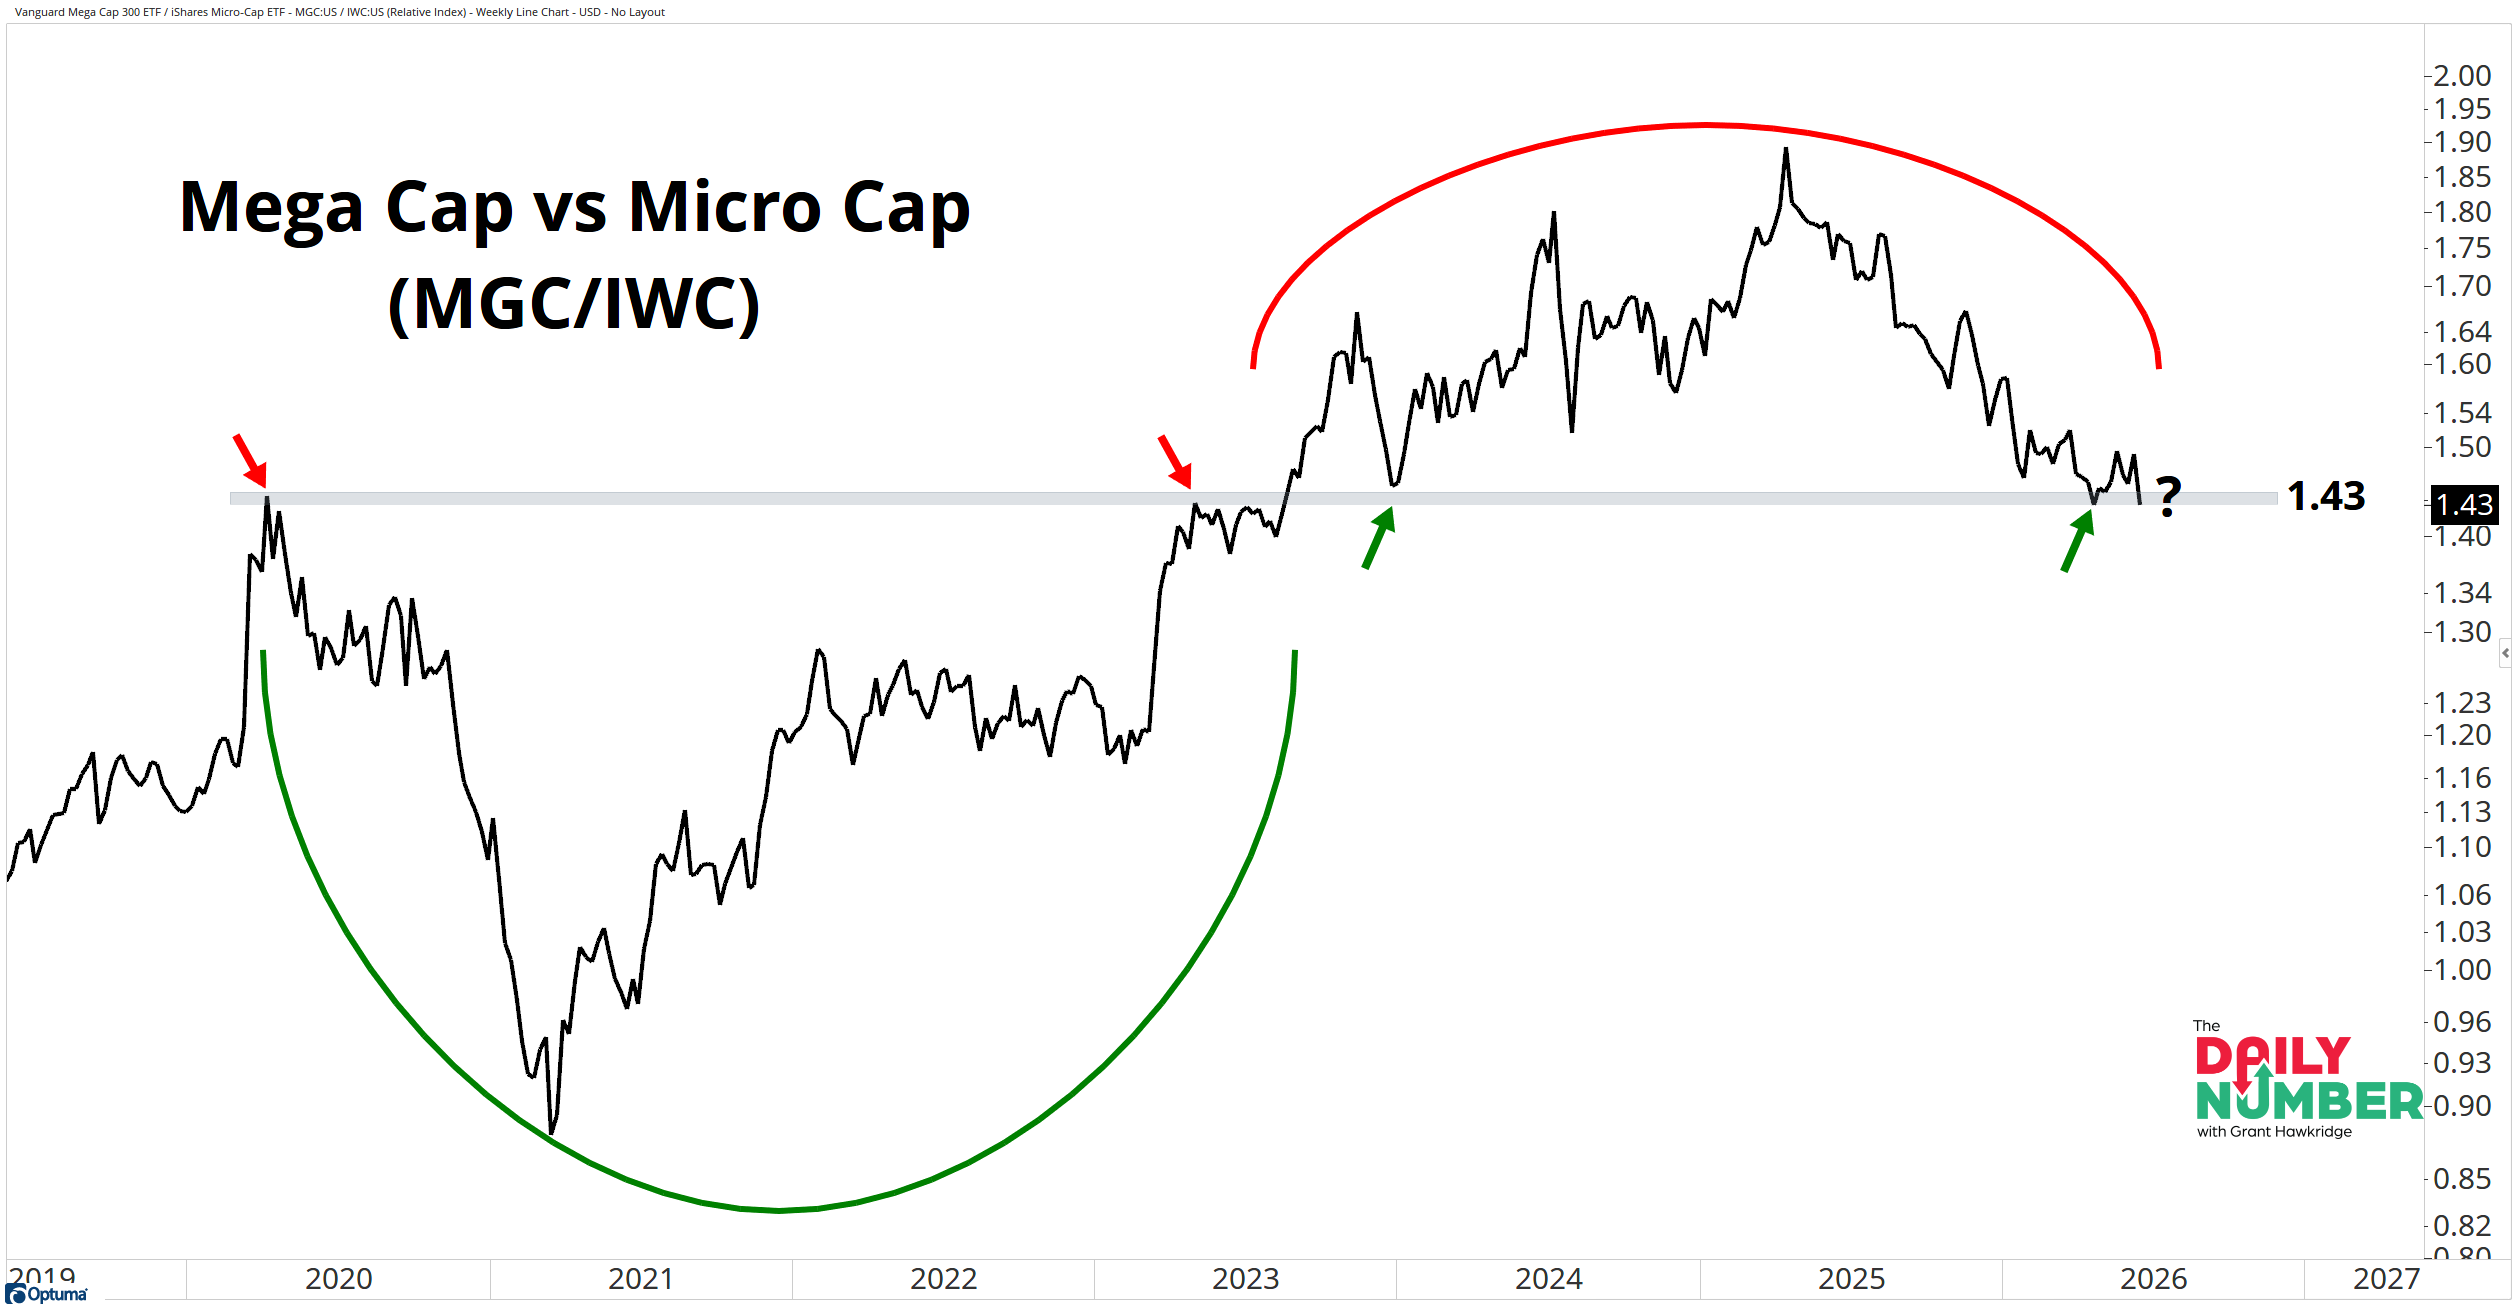
The ratio of Mega Cap stocks to Micro Cap stocks is sitting at 1.43. That's a level that has repeatedly acted as both support and resistance over the past six years.
Here’s the chart:
Let's break down what the chart shows:
The chart shows the relative performance of Mega Cap stocks versus Micro Cap stocks in black.
When the ratio rises, Mega Caps outperform Micro Caps.
When the ratio falls, Micro Caps outperform Mega Caps.
The Takeaway: Today's number isn't really about Mega Caps or Micro Caps. It's about leadership.
For most of this bull market, the biggest stocks have done the heavy lifting. If you wanted to own the leaders, you didn't have to look very far. Mega Caps dominated performance while much of the market struggled to keep pace.
That has started to change.
The ratio has been trending lower for the past 14 months, which means Micro Caps have quietly been gaining ground relative to Mega Caps. It hasn't been dramatic. It hasn't made headlines. But the trend has been moving in one direction for more than a year.
Now we're back at 1.43.
This level has influenced leadership multiple times over the past six years. It capped the ratio in 2020 and again in 2023 before becoming support later that year. The market is back at that same decision point today.
The reason I care is simple. Bull markets become stronger when leadership expands. A rally driven by seven stocks can work for a while. A rally driven by hundreds of stocks is much harder to stop.
That's what makes this level so interesting. The market already knows Mega Caps can lead. The question is whether leadership is ready to spread further down the market cap spectrum.
For my own trading, I'm watching 1.43 as a gauge of where I should be spending my time.
If the ratio breaks lower, it would suggest leadership continues to spread beyond the biggest names in the market. That's the type of environment where I want to spend more time digging through Small Caps and Micro Caps. The broader the leadership becomes, the more places there are to find strong stocks.
If the ratio holds and turns higher, the message is different. It would suggest investors still prefer the largest and most liquid companies. In that environment, I would expect many of the stocks that have already been leading this bull market to continue getting the benefit of the doubt.
I'm not treating 1.43 as a buy signal or a sell signal. I'm treating it as a roadmap. The next move should help identify where the strongest trends are likely to come from over the months ahead.
This isn't about predicting the next move. It's about following the leadership.