Zero major US stock market indices are below their 50-day moving average, below their 200-day moving average, or have a falling 200-day moving average.
Here’s the table:
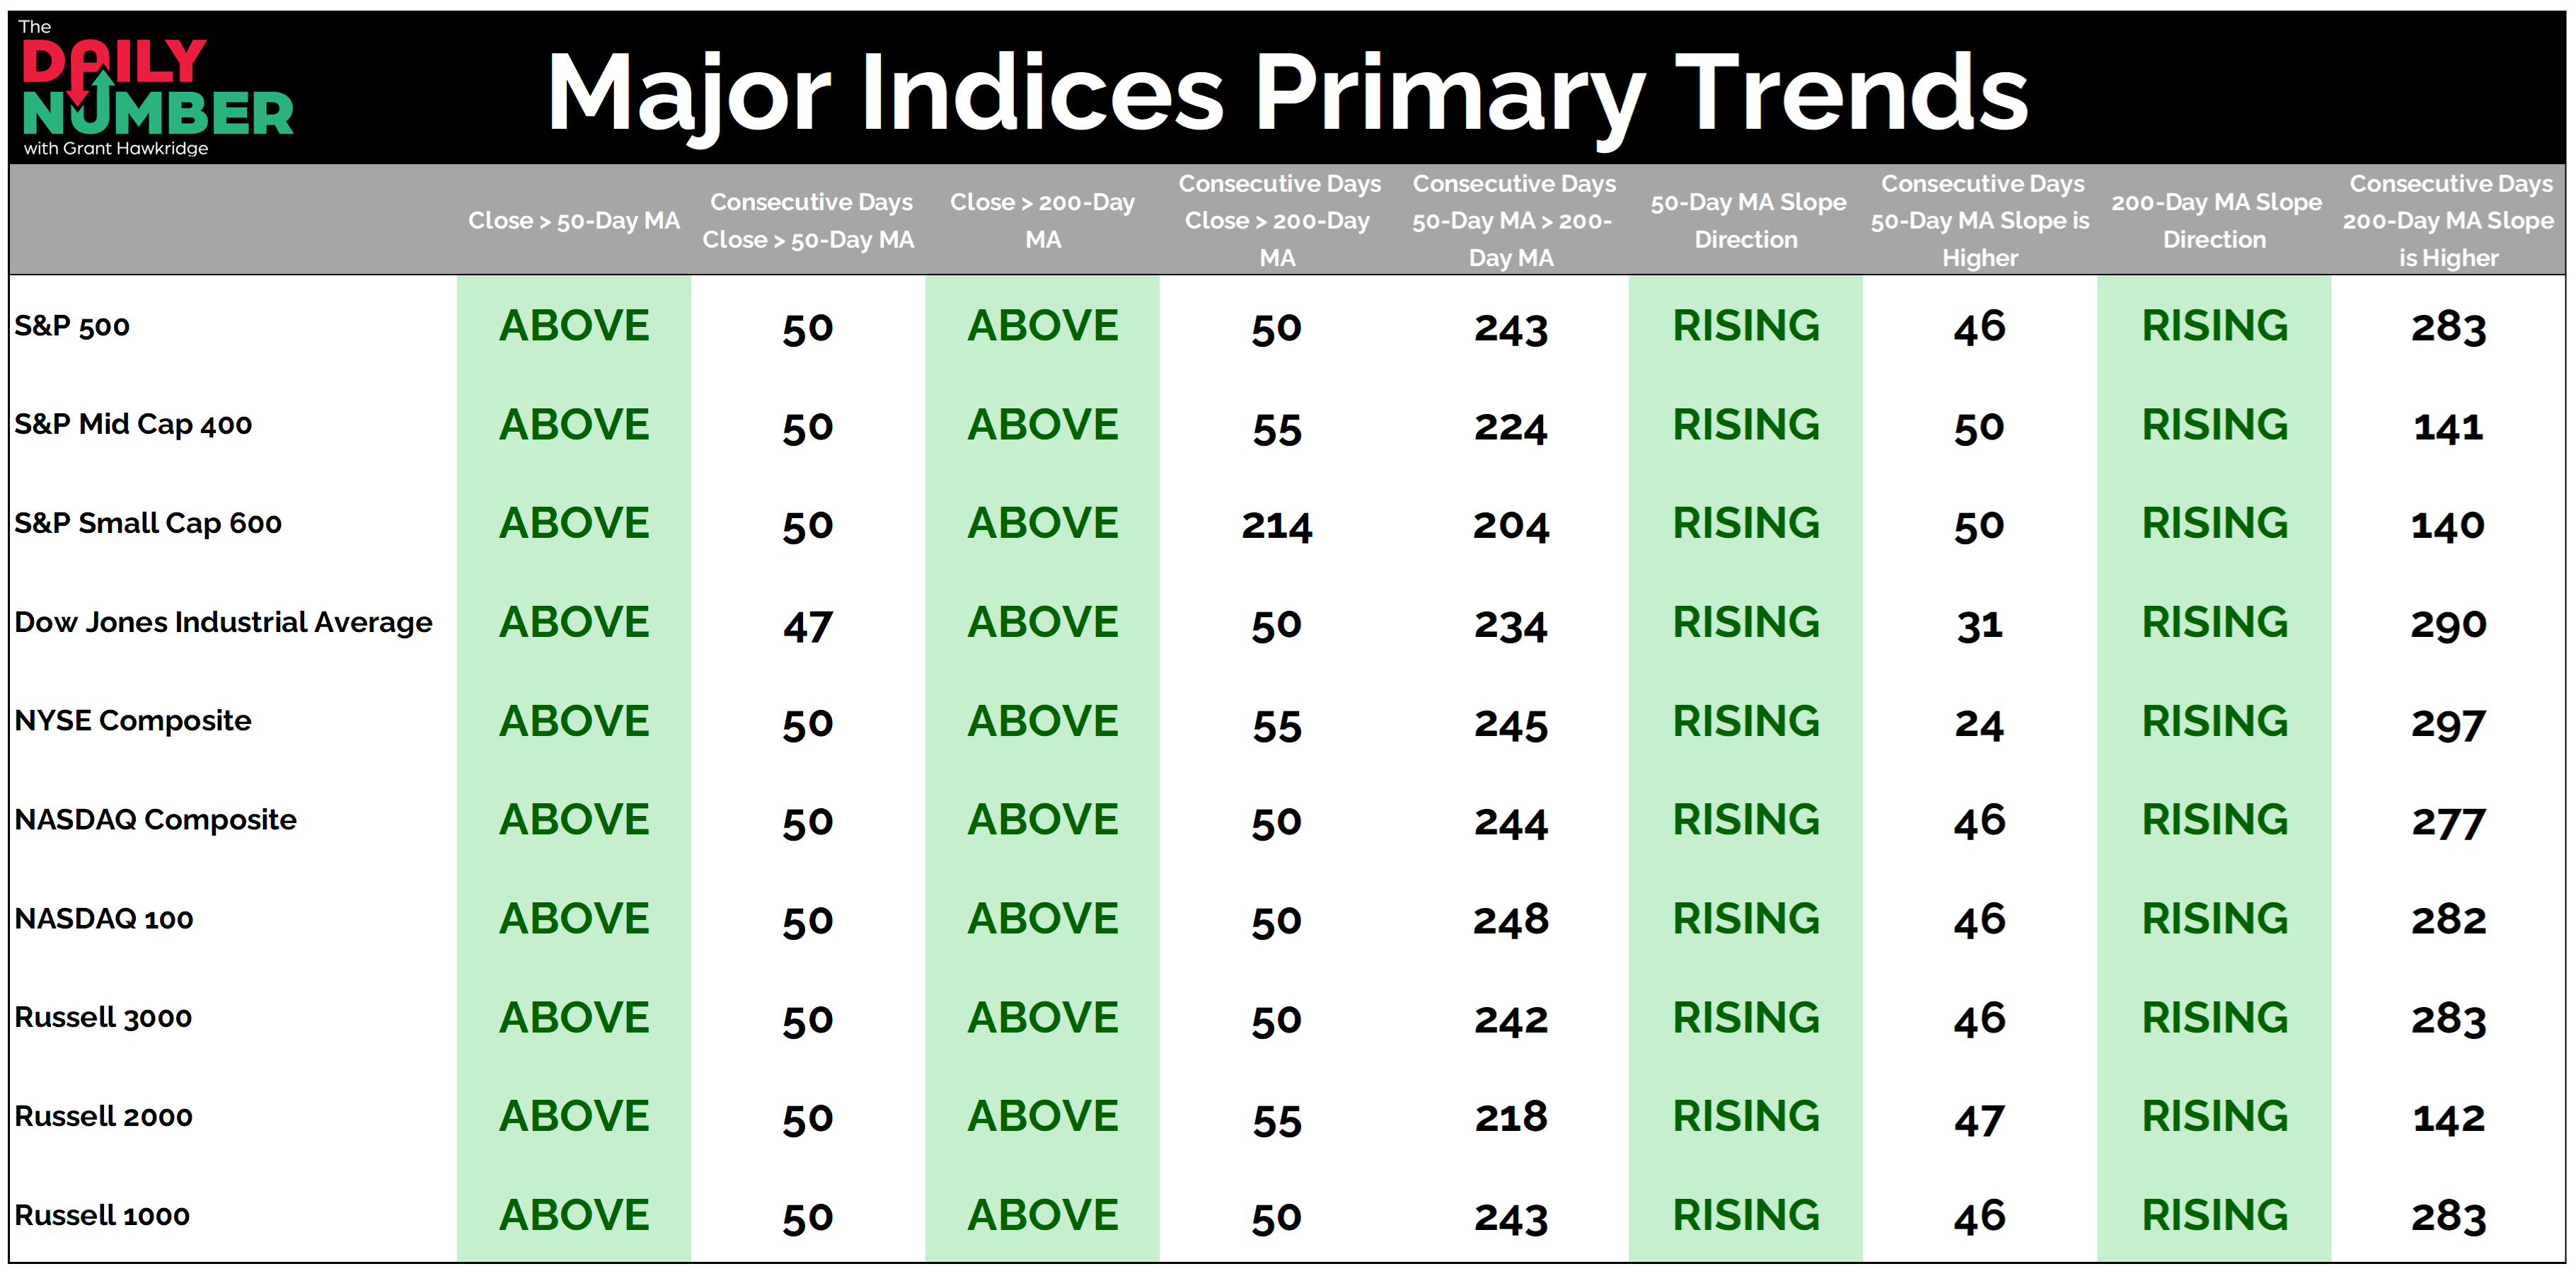
Let's break down what the table shows:
The table displays ten major US stock market indices.
The columns show whether each index is above or below its 50-day and 200-day moving averages.
Additional columns display the number of consecutive days each index has remained above those moving averages.
The table also displays whether the 50-day and 200-day moving averages are rising or falling.
The final columns display the number of consecutive days each moving average has remained in its current direction.
The Takeaway: In yesterday's Daily Number, I showed you the primary trend in just the S&P 500.
The takeaway was simple. The world's largest and most important stock market remains in a primary uptrend.
Today, I want to take that idea one step further.
Because the S&P 500 isn't the market. It's one index.
If the bull market is healthy, you should expect to see the same trend showing up across large caps, mid caps, small caps, and broader market indices. You should expect strength to be widespread, not concentrated in a handful of stocks carrying the weight for everyone else.
Every major index on this list is above its 50-day moving average. Every major index is above its 200-day moving average. Every major index has a rising 50-day moving average. Every major index has a rising 200-day moving average.
This isn't a market that just turned higher. The long-term trends have been rising for months. The NYSE Composite has a rising 200-day moving average for 297 trading days. The Dow Jones Industrial Average sits at 290 days. The S&P 500, Nasdaq 100, and Russell 3000 have all maintained rising 200-day moving averages for more than 280 days.
The number that jumps off the page isn't 297. It isn't 290. It isn't 283.
It's zero.
There are zero major indices below their 50-day moving average. Zero below their 200-day moving average. Zero with a falling 50-day moving average. Zero with a falling 200-day moving average.
Traders like to spend a lot of time looking for reasons to be bearish. This table asks a different question.
Where is the weakness?
Right now, it's difficult to find.
The primary uptrend isn't limited to the S&P 500. It's showing up across every major segment of the US stock market. Until that changes, I'm going to keep respecting what the market is doing, not what people think it should do.
Grant Hawkridge | Chief Aussie Operator, All Star Charts
Every day, Spencer sits across from some of the smartest analysts in the business and listens to their best trade ideas.
The SMTV Portfolio is what happens when he takes the ones he actually wants to own and puts real money behind them... long-term core positions, swing trades from the analyst network, and a monthly options play.