We've just entered the 7th month of the year… July. It also happens to be the month "Sell in May" forgot.
Here’s the chart:
Let's break down what the chart shows:
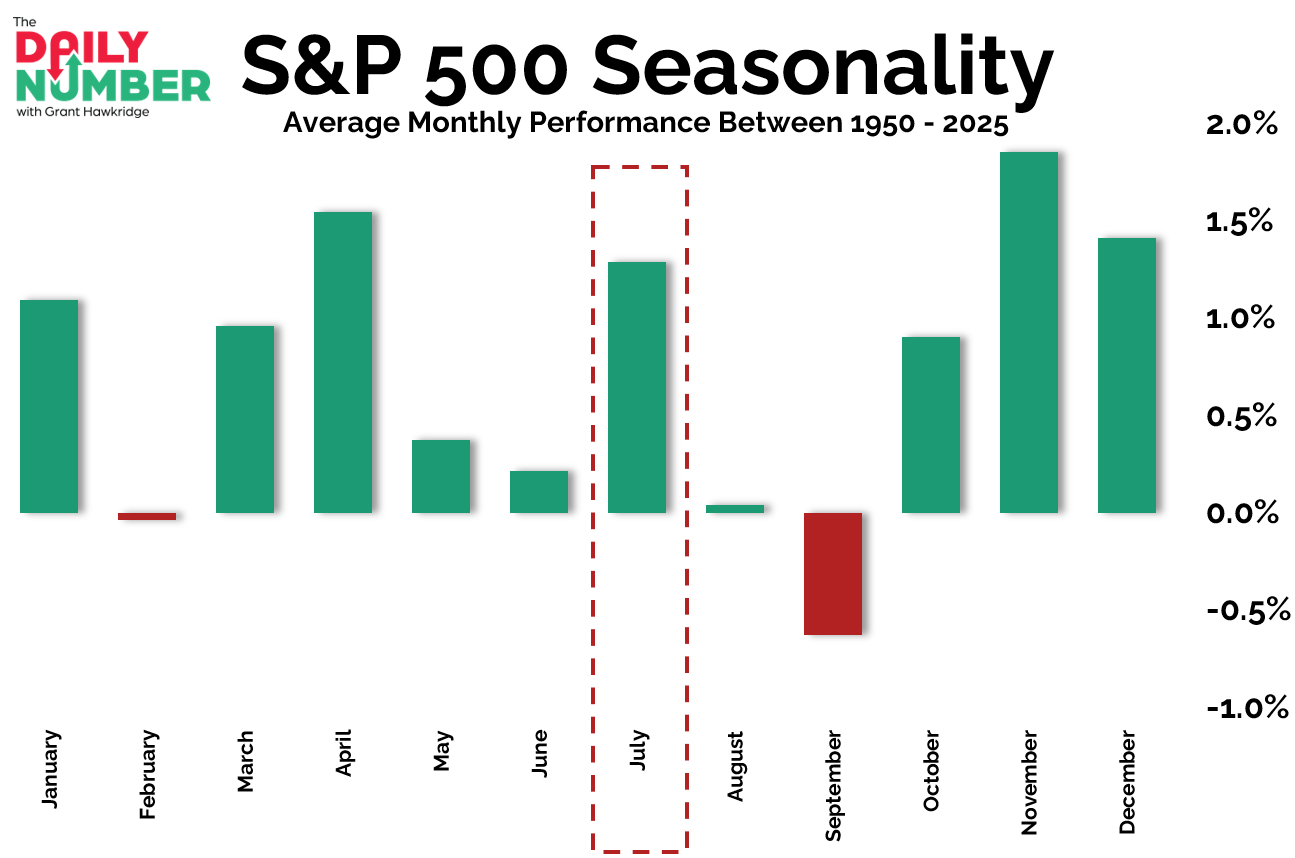
The chart displays the S&P 500's average monthly return from January through December since 1950. Each month is shown as a separate bar, with green bars representing positive average returns and red bars representing negative average returns.
The Takeaway: Everyone knows the old saying: "Sell in May and Go Away."
The problem is July.
We've just entered the strongest month between May and October. Since 1950, only April, November, and December have delivered higher average returns. Investors who simply stepped aside for the entire six-month period would have regularly missed one of the market's better seasonal opportunities.
July also breaks up what many think is one long stretch of seasonal weakness.
Average returns cool after April, hold up through May and June, then pick up again in July before fading into August and bottoming in September.
None of this guarantees July will be strong this year. Seasonality is a tendency, not a prediction. Price, breadth, and leadership will determine whether buyers remain in control. The calendar simply adds another tailwind when the rest of the evidence already points higher.
July deserves more attention because it sits where many investors least expect it, right in the middle of a period that has built its reputation on being weak.
I'm not buying stocks just because the calendar has flipped to July. Seasonality has never been a trading system. But it does become another piece of evidence when the rest of the market is already pointing higher.
If risk appetite remains higher, breadth and leadership keep expanding, July's historical strength becomes another tailwind working in the bulls' favor. That's when seasonal tendencies can help trends travel further than many investors expect.
I'll keep following the market's message first.
This month, history simply gives that message a little more wind at its back.
Grant Hawkridge | Chief Aussie Operator, All Star Charts
Less than 55 cents a day gets you a front-row seat to Spencer Israel's live portfolio.
Every weekday, he sits across the desk from the Morning Show analysts, takes in their best ideas, and picks the ones he likes most... then puts real money behind it.