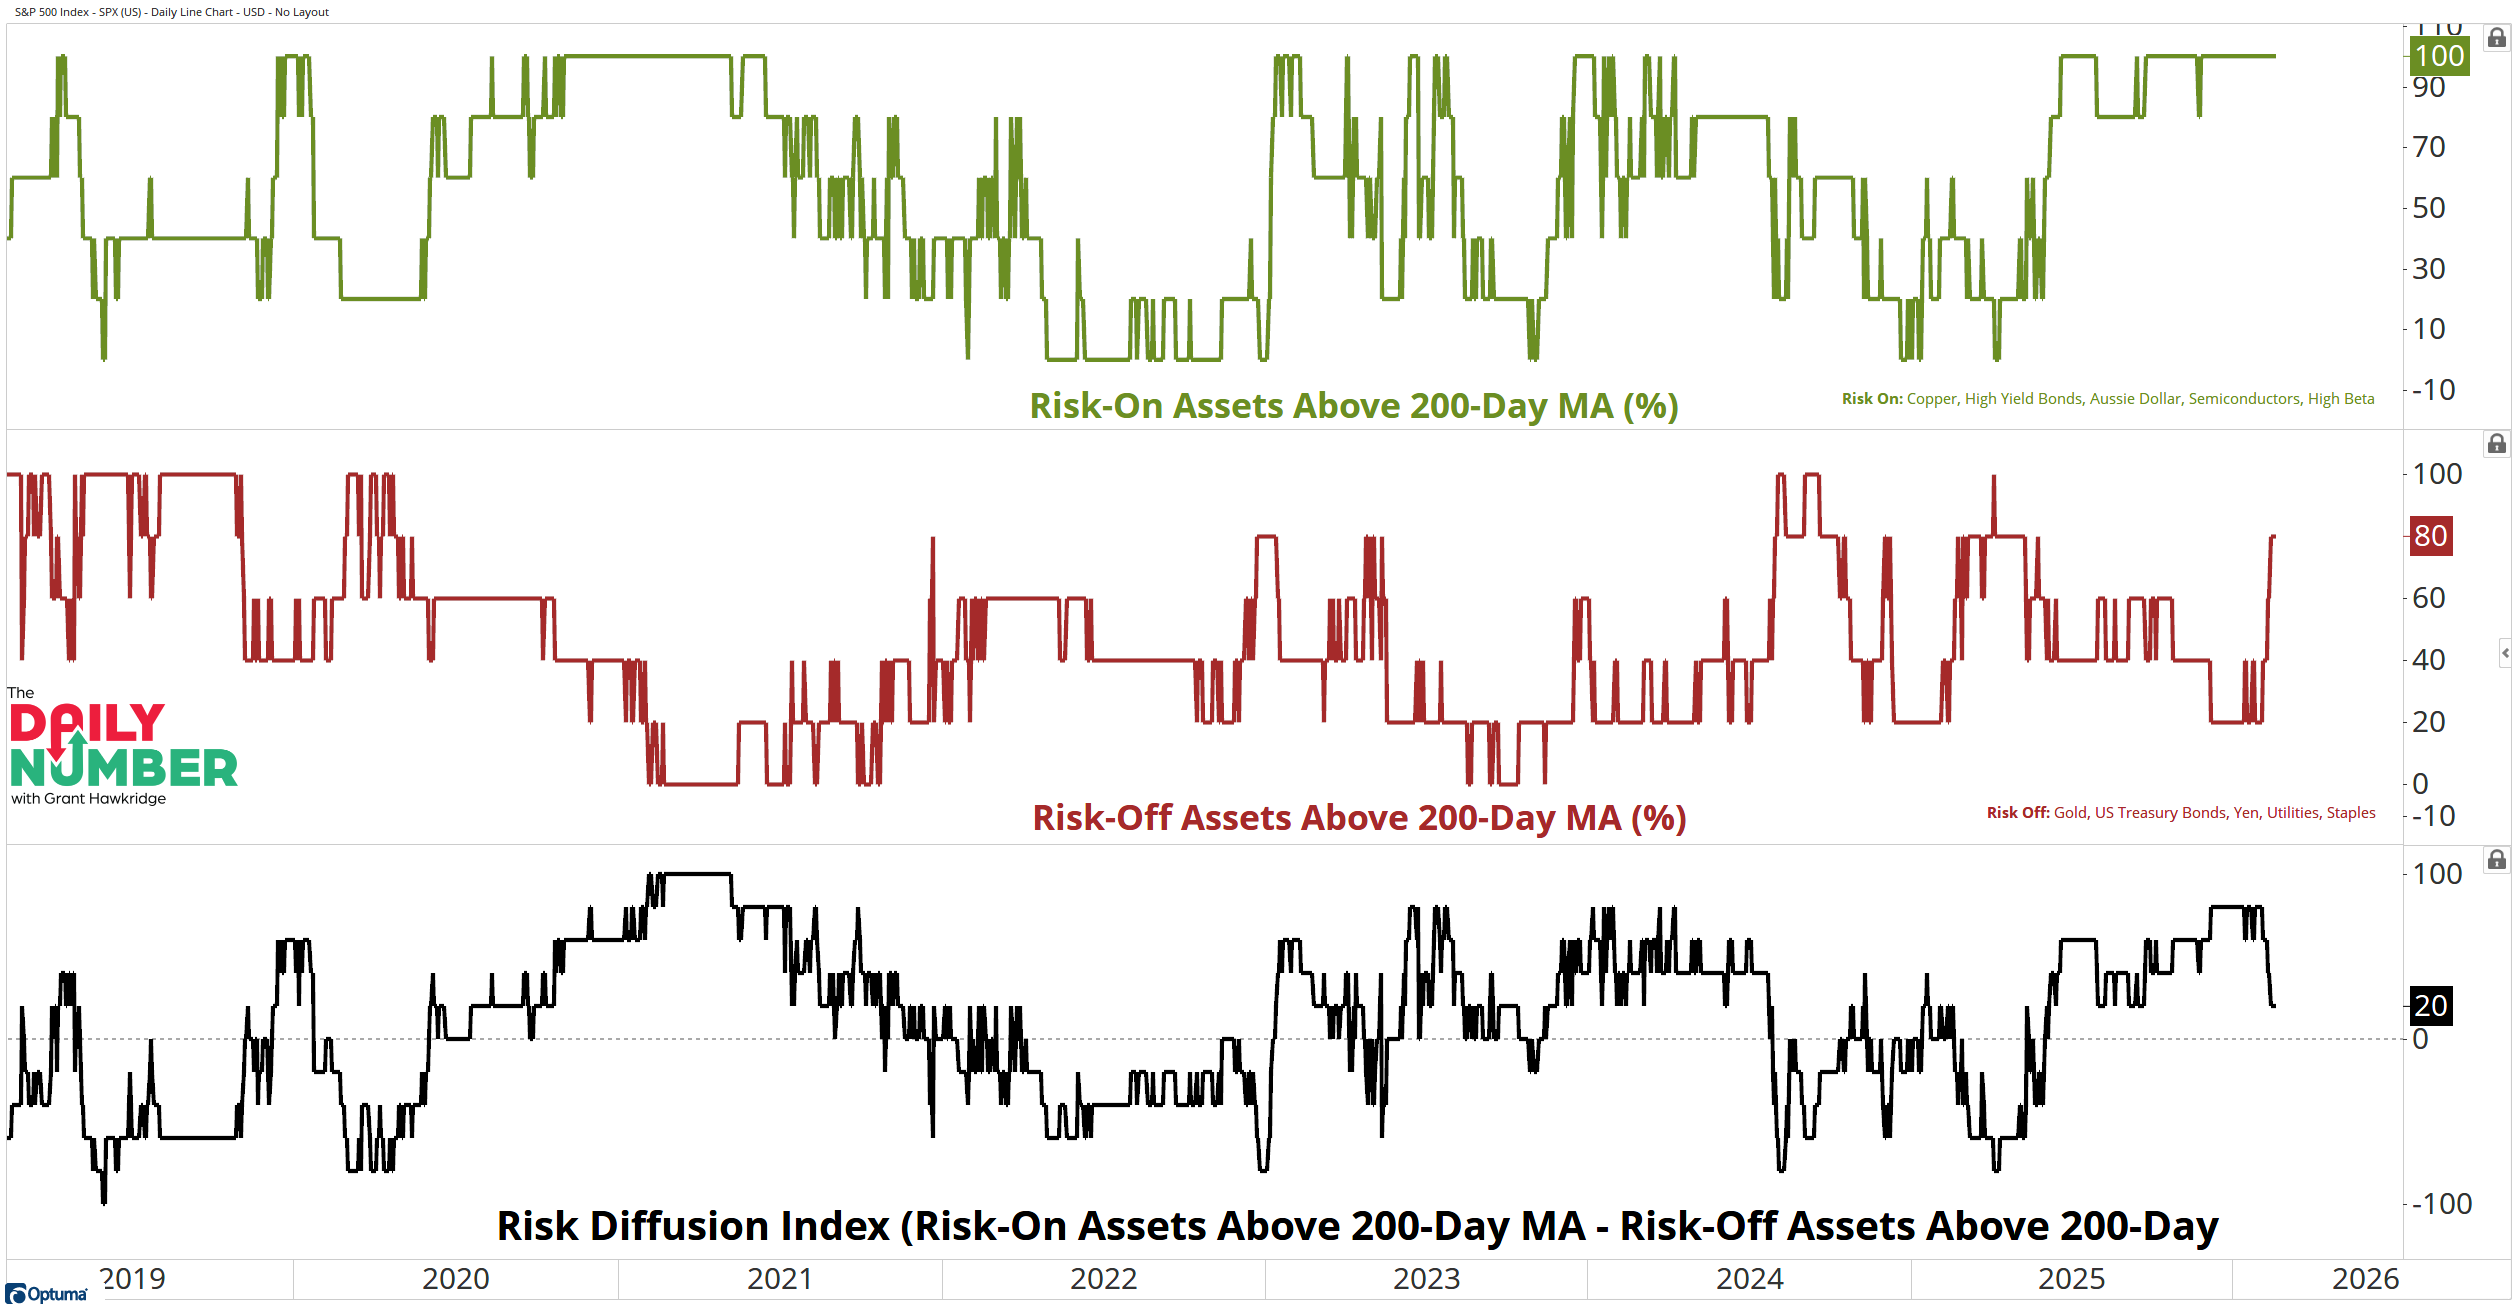
The top green line tracks the % of Risk-On assets trading above their 200-day moving average.
The middle red line tracks the % of Risk-Off assets above their 200-day moving average.
The bottom black line plots the difference between the two readings.
The Takeaway: +20 keeps the regime tilted bullish.
Risk-On assets sit at 100% above their 200-day moving average.
Risk-Off sits at 80%.
But there is a shift underway.
Defensive assets are no longer breaking down. They are trending higher. Gold, bonds, staples, and utilities have all pushed back above their long-term trend at the same time risk assets are also trending higher.
This change in environment is new information.
Clean bull market legs see Risk-On expand while Risk-Off contracts. Right now, both are elevated. The spread is positive, but it has fallen to its lowest level since September 2025.
The market is no longer one-sided. Money is still chasing risk, but it is also parking money into defensive areas of the market.
This mix trims the bullish edge, but it does not reverse it.
The bull case still wins on weight. But the cushion is thinner than it used to be. If Risk-On slips and Risk-Off holds, that +20 switches fast.
Do the bulls widen the spread, or does defense take another step forward?