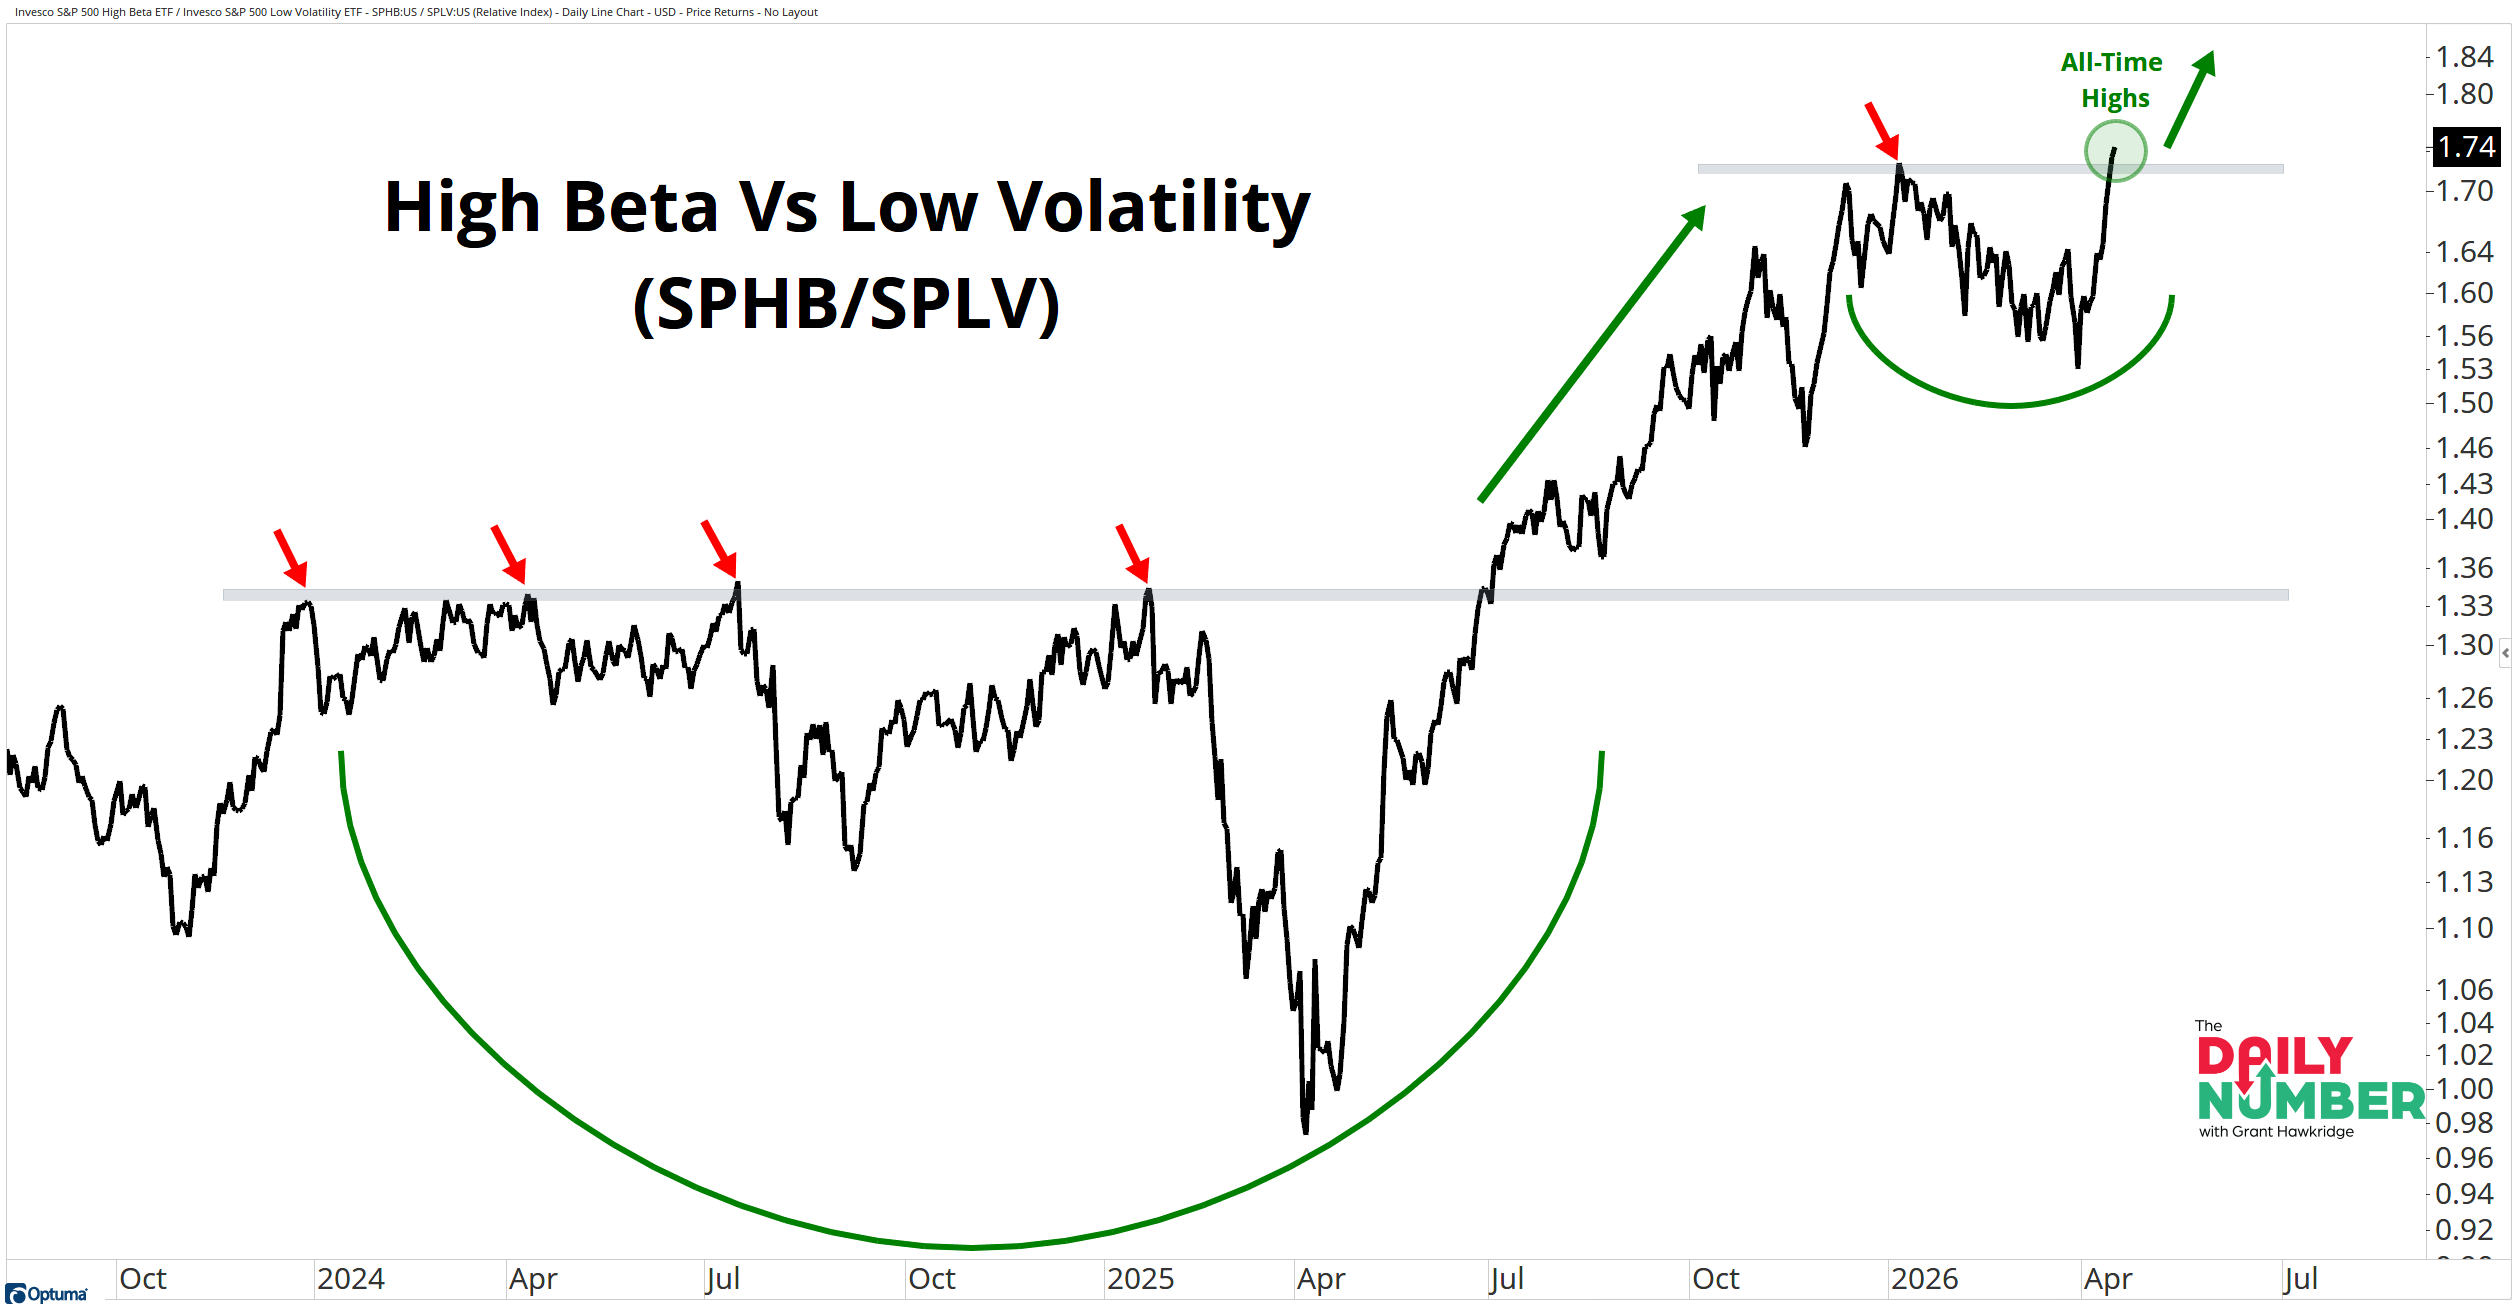
The High Beta vs Low Volatility ratio just broke out to fresh all-time highs at 1.74.
Here’s the chart:
Let's break down what the chart shows:
The chart shows the ratio of High Beta vs Low Volatility as a black line.
The Takeaway: The ratio just broke to 1.74 and pushed to fresh all-time highs.
The first base took 18 months to build. Price kept running into the same resistance ceiling and failing. That’s where supply sat. It finally cleared that level and broke out.
That breakout held. Price moved higher and never lost the level. There was no move back into the range. The bulls stayed in control the whole way through.
Then since the start of 2026, it stopped trending and started consolidating. Tight range, right under the highs.
Now it’s breaking out again. That completes the full base-on-base pattern. Long base, expansion, another base, now another push higher.
That’s how strong trends extend.
You see it in the names driving the ratio.
High beta names are the ones that move the most. Think HOOD, COIN, CVNA, AMD. Bigger swings, more upside when things are working.
Low vol names are the opposite. Think AMAT, TMO, DE, FDX. Slower, steadier, where money tends to sit when it gets defensive.
High beta leading low vol is risk appetite. Money isn’t sitting in defense. It’s rotating into higher beta names where the swings are bigger and the upside is higher.
This is what you expect to see in bull markets.
The hard part was getting out of the base. That’s done. Now it’s about how far this move can go.