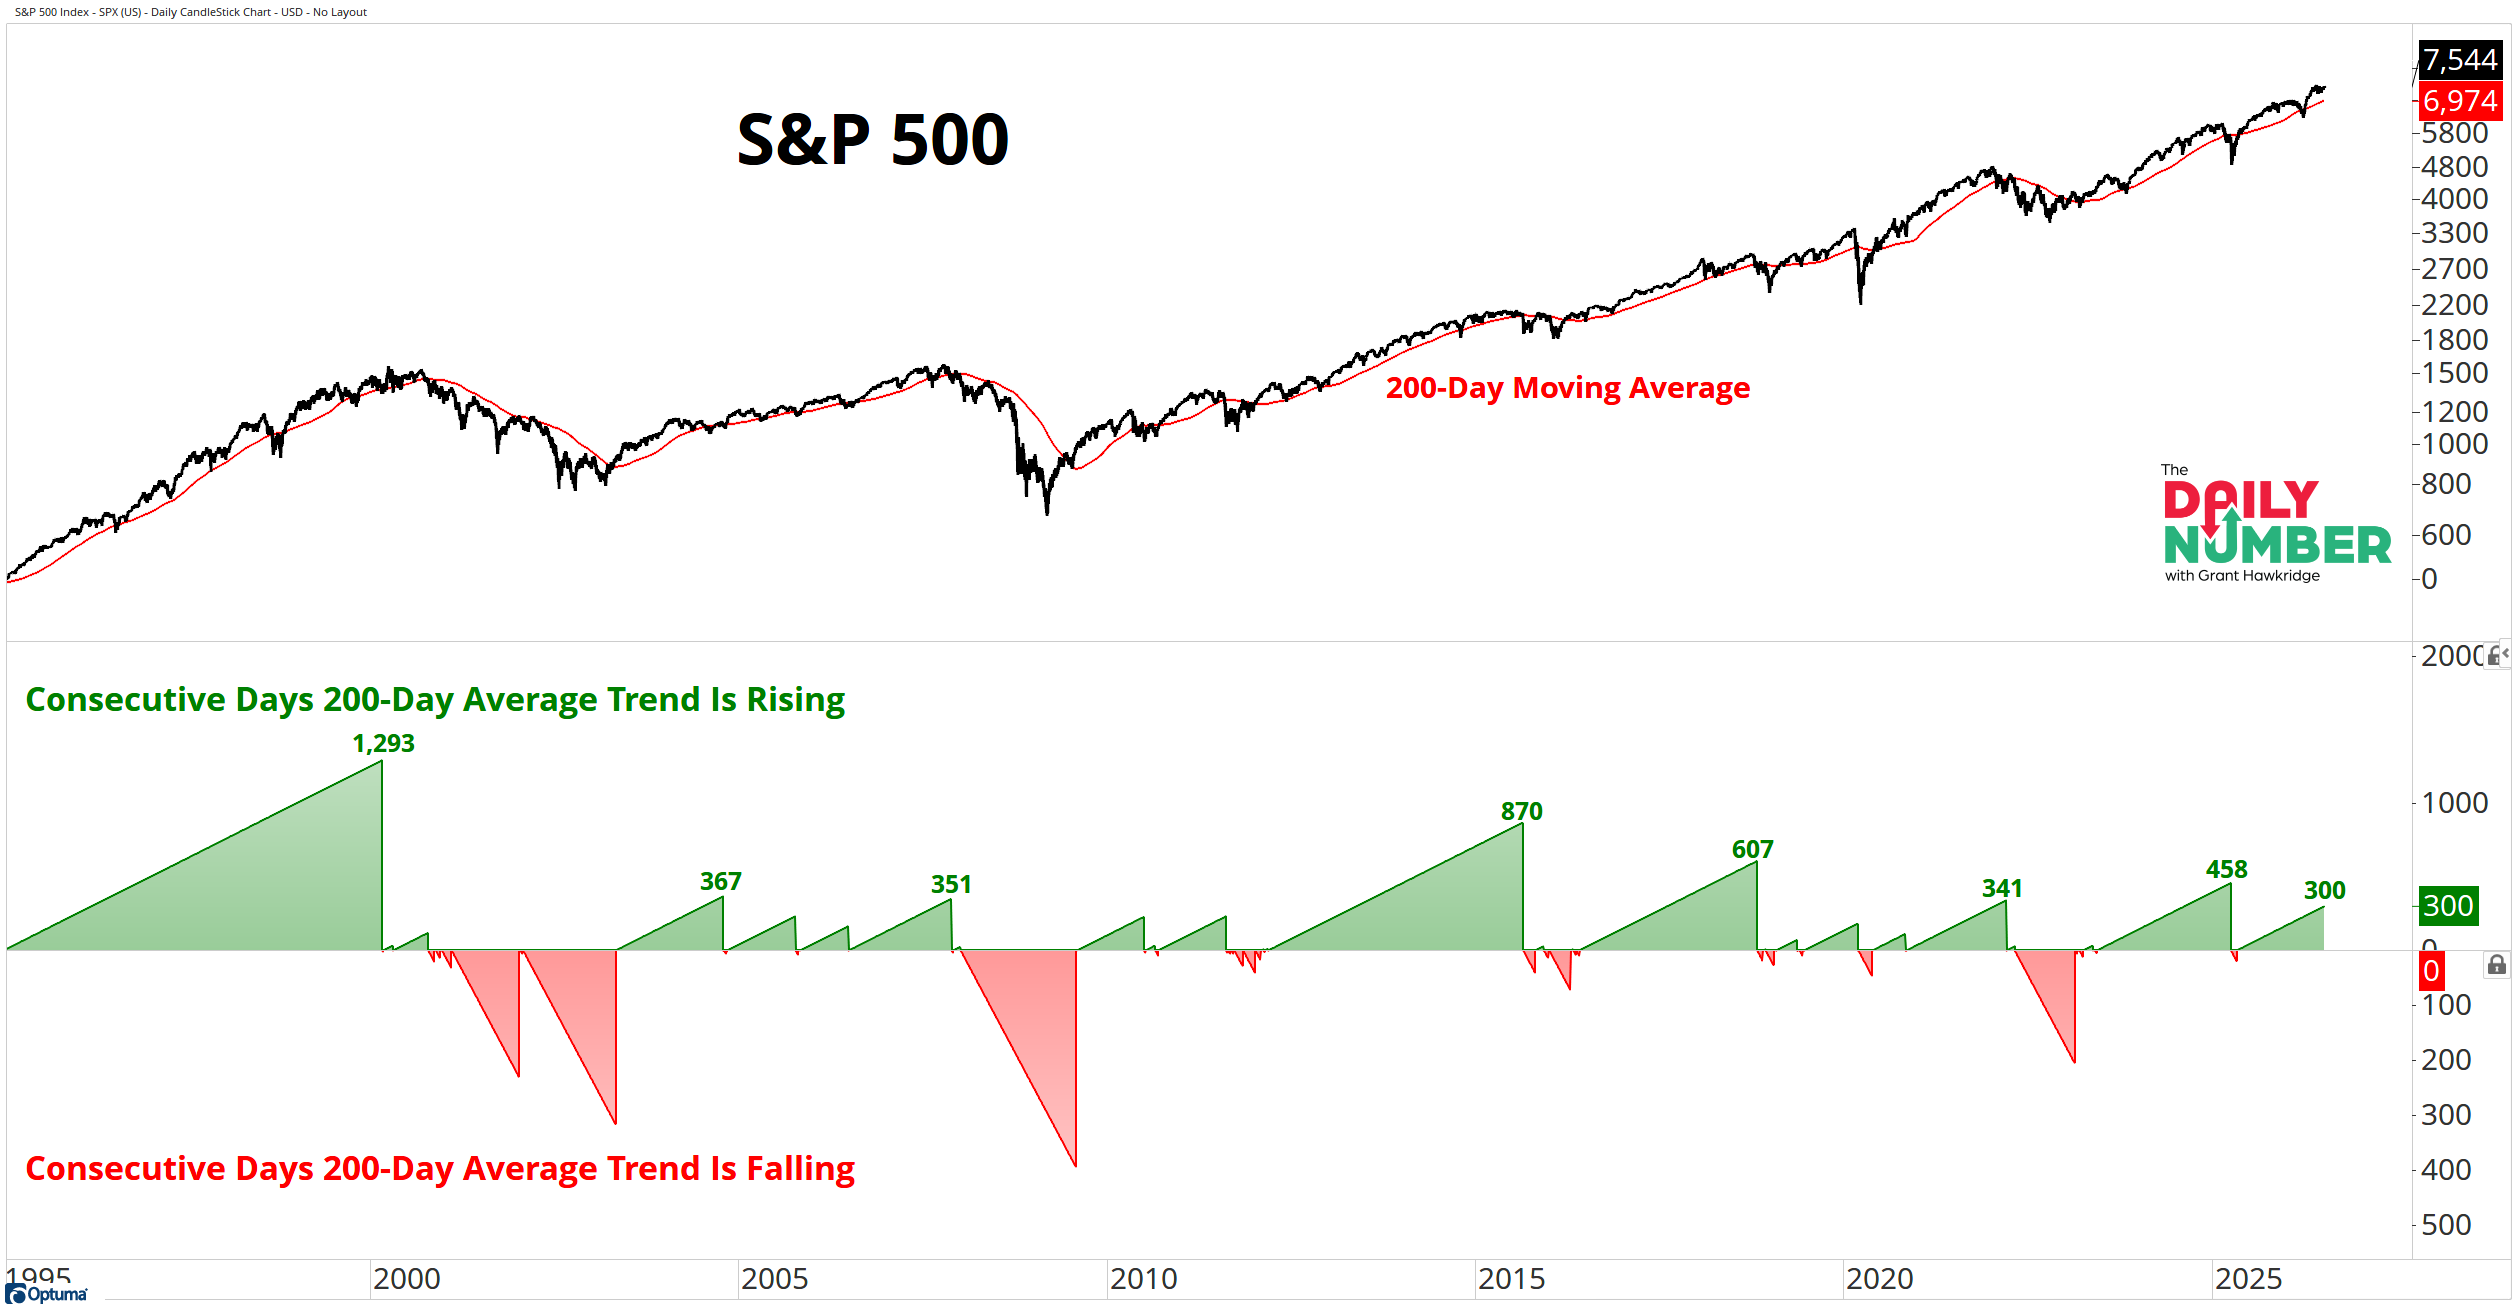
The S&P 500's 200-day moving average has now been rising for 300 consecutive trading days. That means the market's primary trend has been moving higher for roughly 14 months of trading. And with price still comfortably above a rising 200-day moving average, the evidence remains bullish.
Here’s the chart:
Let's break down what the chart shows:
The black line in the top panel shows the S&P 500.
The red line shows the S&P 500's 200-day moving average.
The lower panel tracks the number of consecutive trading days the 200-day moving average has been rising or falling.
Green areas show periods when the 200-day moving average is rising.
Red areas show periods when the 200-day moving average is falling.
The Takeaway: 300 days is a long time for the S&P 500's primary trend to keep rising. But history shows it is nowhere near extreme.
Price remains comfortably above a rising 200-day moving average. That combination is important because it gives us two pieces of evidence pointing in the same direction. The market is above its long-term trend, and that trend itself is still moving higher.
The 200-day moving average is one of the simplest ways to define the primary trend. When it is rising, the long-term path of the market is higher. Right now, that has been the case for 300 consecutive trading days.
But here is where investors can easily misread the evidence.
A 300-day streak might sound old. It might feel as though the market has been rising for too long. But the chart shows previous rising trends lasting 341, 351, 367, 458, 607, 870 and even 1,293 trading days.
So 300 days is significant. It is just not historically extreme.
And that is why I would be careful about treating the age of the trend as a reason to become bearish. Trends do not end because they have lasted a long time. They end when the evidence changes.
For me, the more important question is not how long the 200-day moving average has been rising. It is whether that average is still rising at all. Right now, it is.
So I continue to respect the primary uptrend. Corrections can happen. Volatility can return. But neither automatically means the long-term trend has changed.
Investors naturally ask how much longer a rising trend can last. I would rather ask a different question: what evidence is there that it has ended?
Right now, based on this chart alone, there isn't any.