S&P 600 small caps are up 13.6% year to date, leading every major size and style group.
Here’s the chart:
Let's break down what the chart shows:
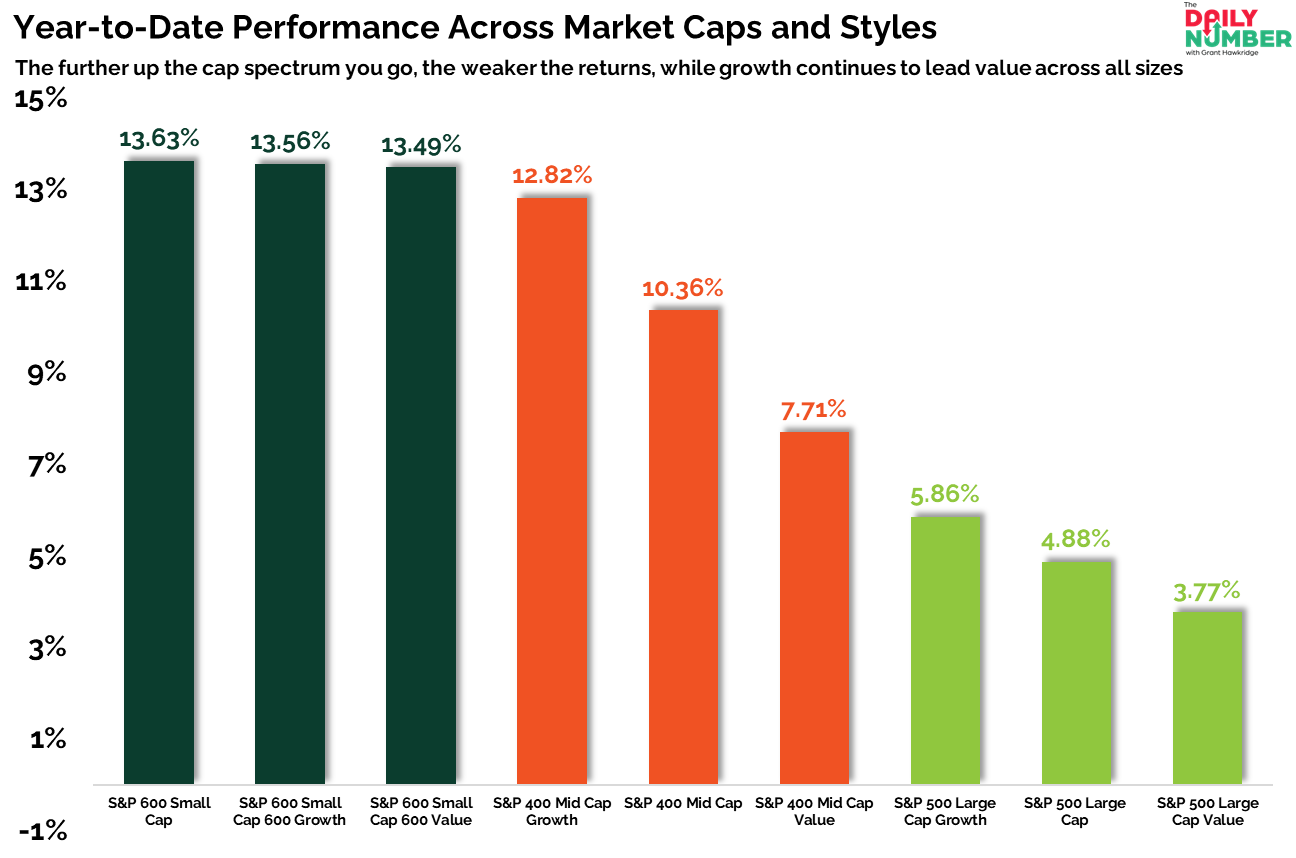
The chart displays nine vertical bars representing year-to-date returns across small caps, mid caps, and large caps.
Small caps are shown in dark green, mid caps in orange, and large caps in light green.
The Takeaway: S&P 600 small caps are leading the year to date return race. The group is up 13.6%, while mid caps sit lower and large caps are well behind.
Small cap growth, core, and value are all clustered at the same level. There is no spread within the group, which means bulls are buying the entire space rather than picking spots.
Returns step down as you move up in size.
Mid cap growth holds at 12.8%, but value drops to 7.7%, creating a clear gap between the two. Large caps sit at the bottom of the table, with growth at 5.9% and value at 3.8%, less than half of what small caps are doing.
Growth is outperforming value at every level, but the spread is tight in small caps and widens as you move into mid and large caps. Leadership becomes more selective as size increases.
Money is moving down the cap spectrum into smaller, higher beta stocks, and not into large cap exposure.
So right now, you either own small caps or you’re underperforming.
Grant Hawkridge | Chief Aussie Operator, All Star Charts
Coinbase missed on earnings. Strazza's team bought $5 calls and walked away with a 4x return. He broke down exactly how... and the other trades his system is firing on right now.