The Market Is Closer to a New High Than a Correction 📍
By Grant Hawkridge
June 10, 2026
Today's number is… 2.9%
The S&P 500 is currently trading just 2.9% below its all-time high.
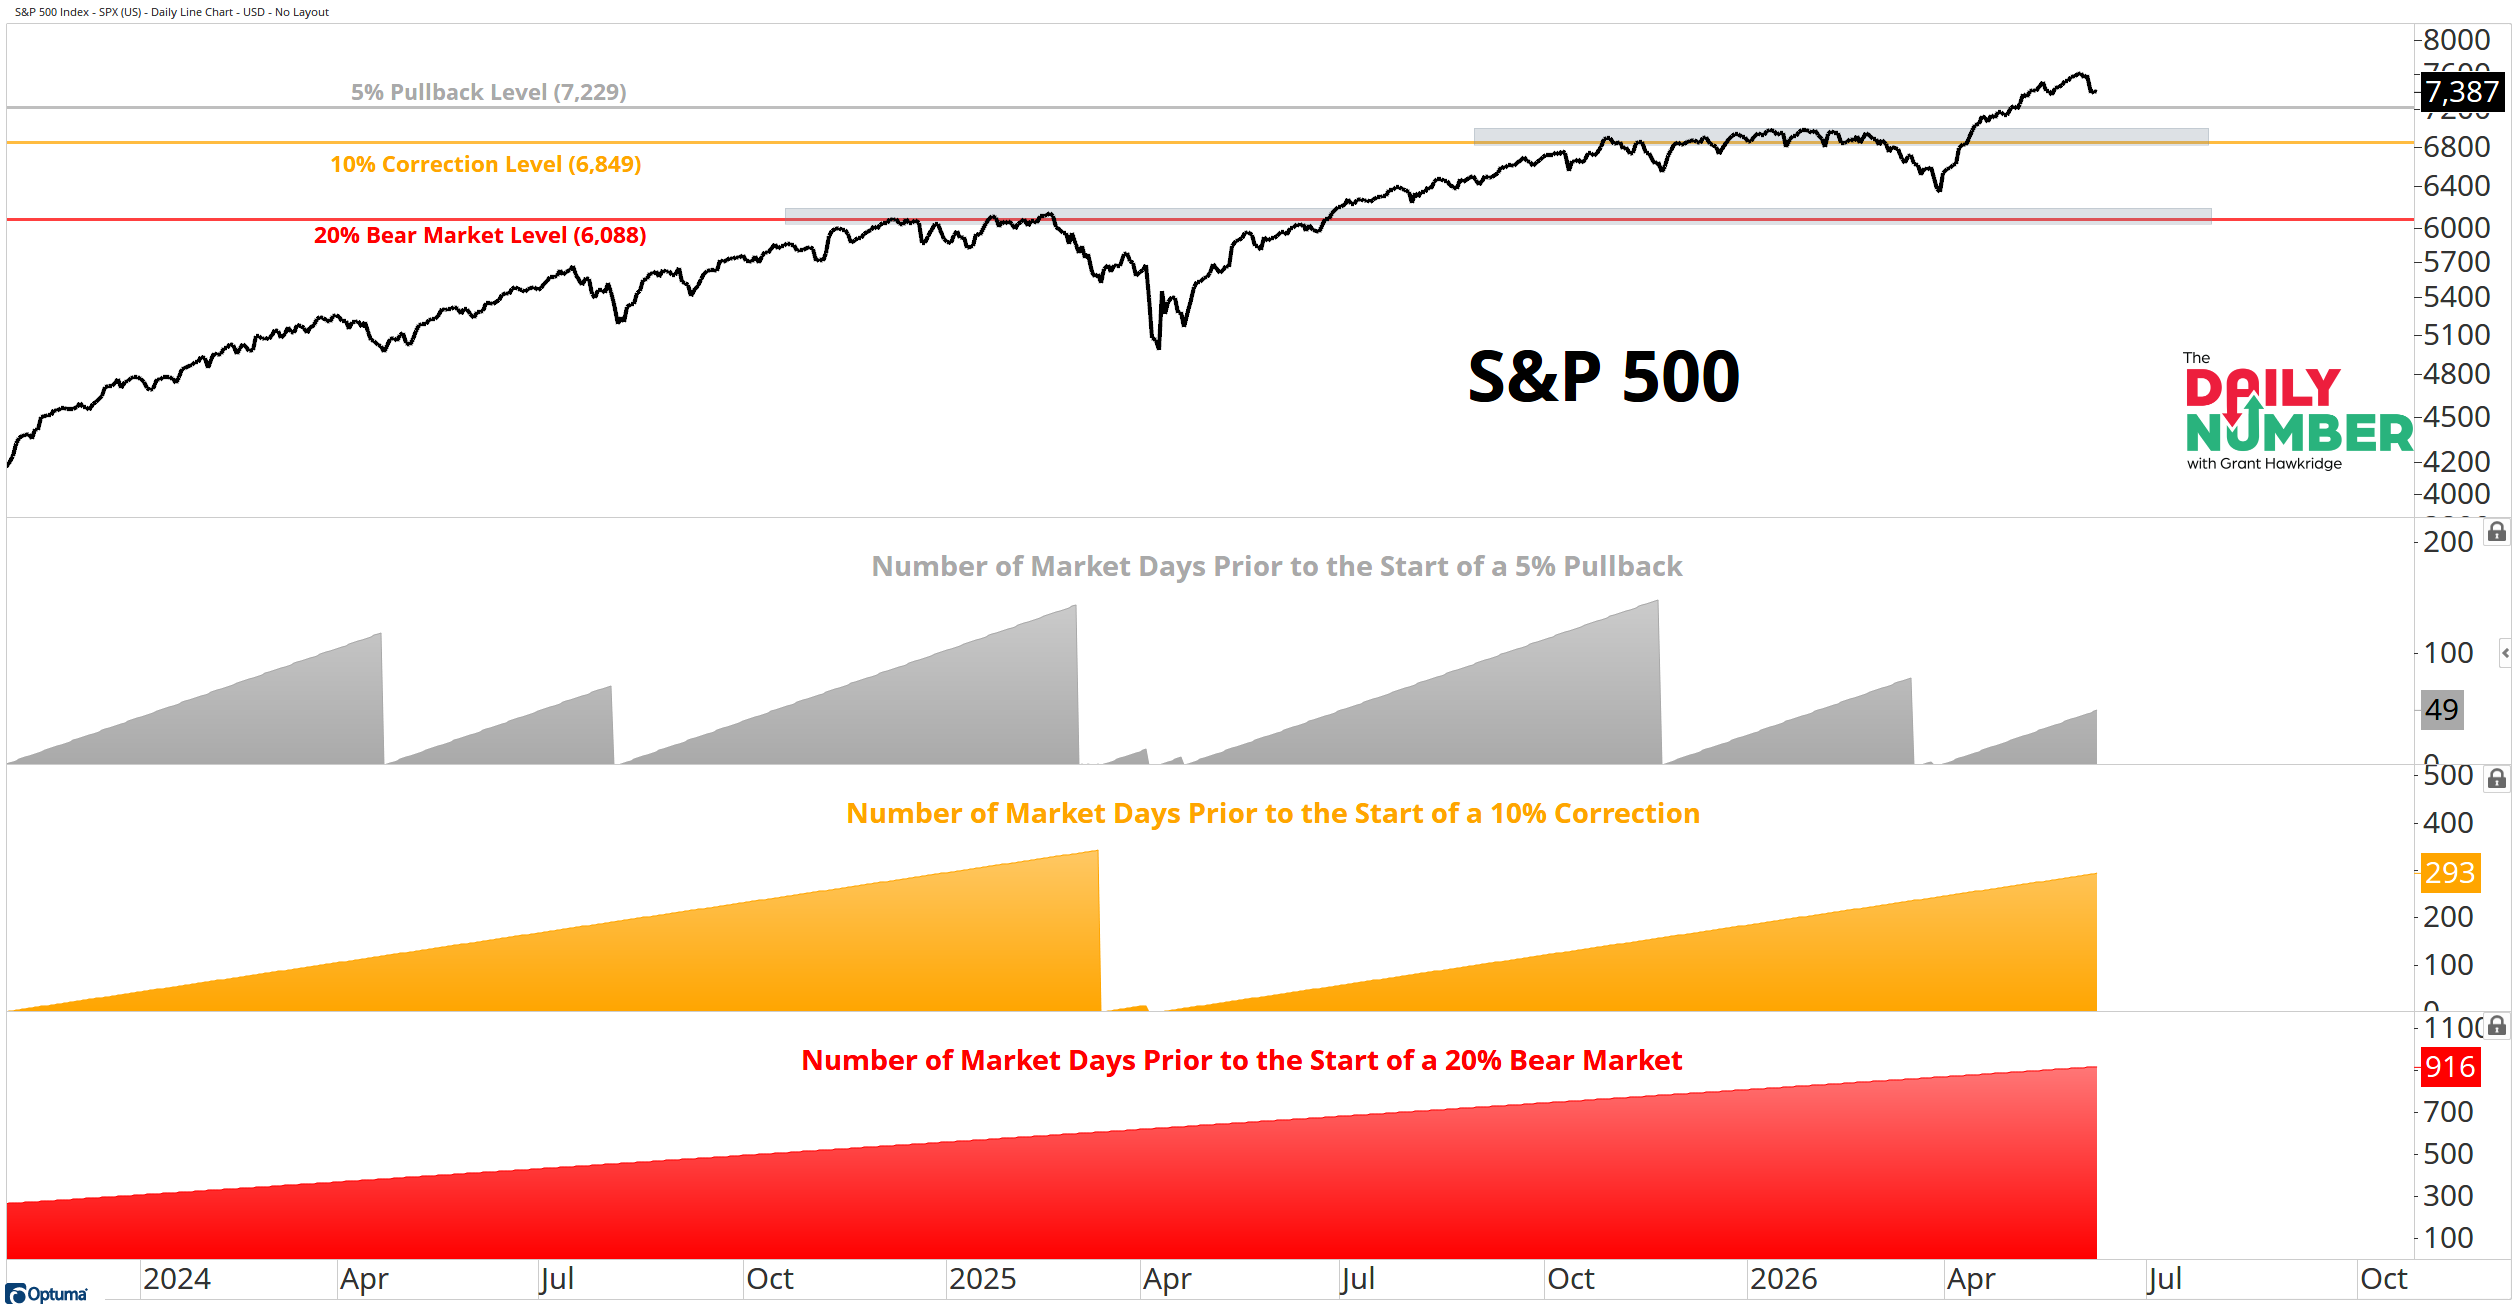
Here’s the chart:
Let's break down what the chart shows:
The top panel displays the S&P 500 in black.
A grey horizontal line marks the 5% pullback level at 7,229.
An orange horizontal line marks the 10% correction level at 6,849.
A red horizontal line marks the 20% bear market level at 6,088.
The second panel displays the number of trading days since the last 5% pullback in grey.
The third panel displays the number of trading days since the last 10% correction in orange.
The fourth panel displays the number of trading days since the last 20% bear market in red.
The Takeaway: The S&P 500 is less than 3% below its all-time high, and the conversation feels very different right now. Spend enough time on social media and you'd think a correction is well underway.
The chart says otherwise.
A 5% pullback doesn't begin until 7,229. A 10% correction doesn't begin until 6,849. A bear market doesn't begin until 6,088.
What's interesting is where those levels actually sit.
A 10% correction would only take the market back to the highs from earlier this year. Investors spent months watching the S&P 500 fight with that area before finally breaking through. Today, it sits nearly 800 points lower and marks the line where a correction would officially begin.
Then there's 6,088.
A 20% decline would take the index back to the major breakout from early 2025. That's where the market finally broke free and started the run to new highs. If the S&P 500 ever falls that far, it would be testing one of the most important levels on the chart.
Could the market revisit those areas? Of course.
Markets pull back. They retest old highs. They revisit breakout levels. None of that would be unusual.
But there's another possibility.
The market never gets there.
Strong uptrends have a habit of frustrating investors who spend their time waiting for the perfect entry point. Sometimes the pullback arrives. Sometimes it doesn't.
For now, I'm treating 6,849 and 6,088 as reference points. If the market starts pulling back, those are the levels I'll be watching. Until then, the S&P 500 remains less than 3% below its all-time high and the trend is still pointing higher.