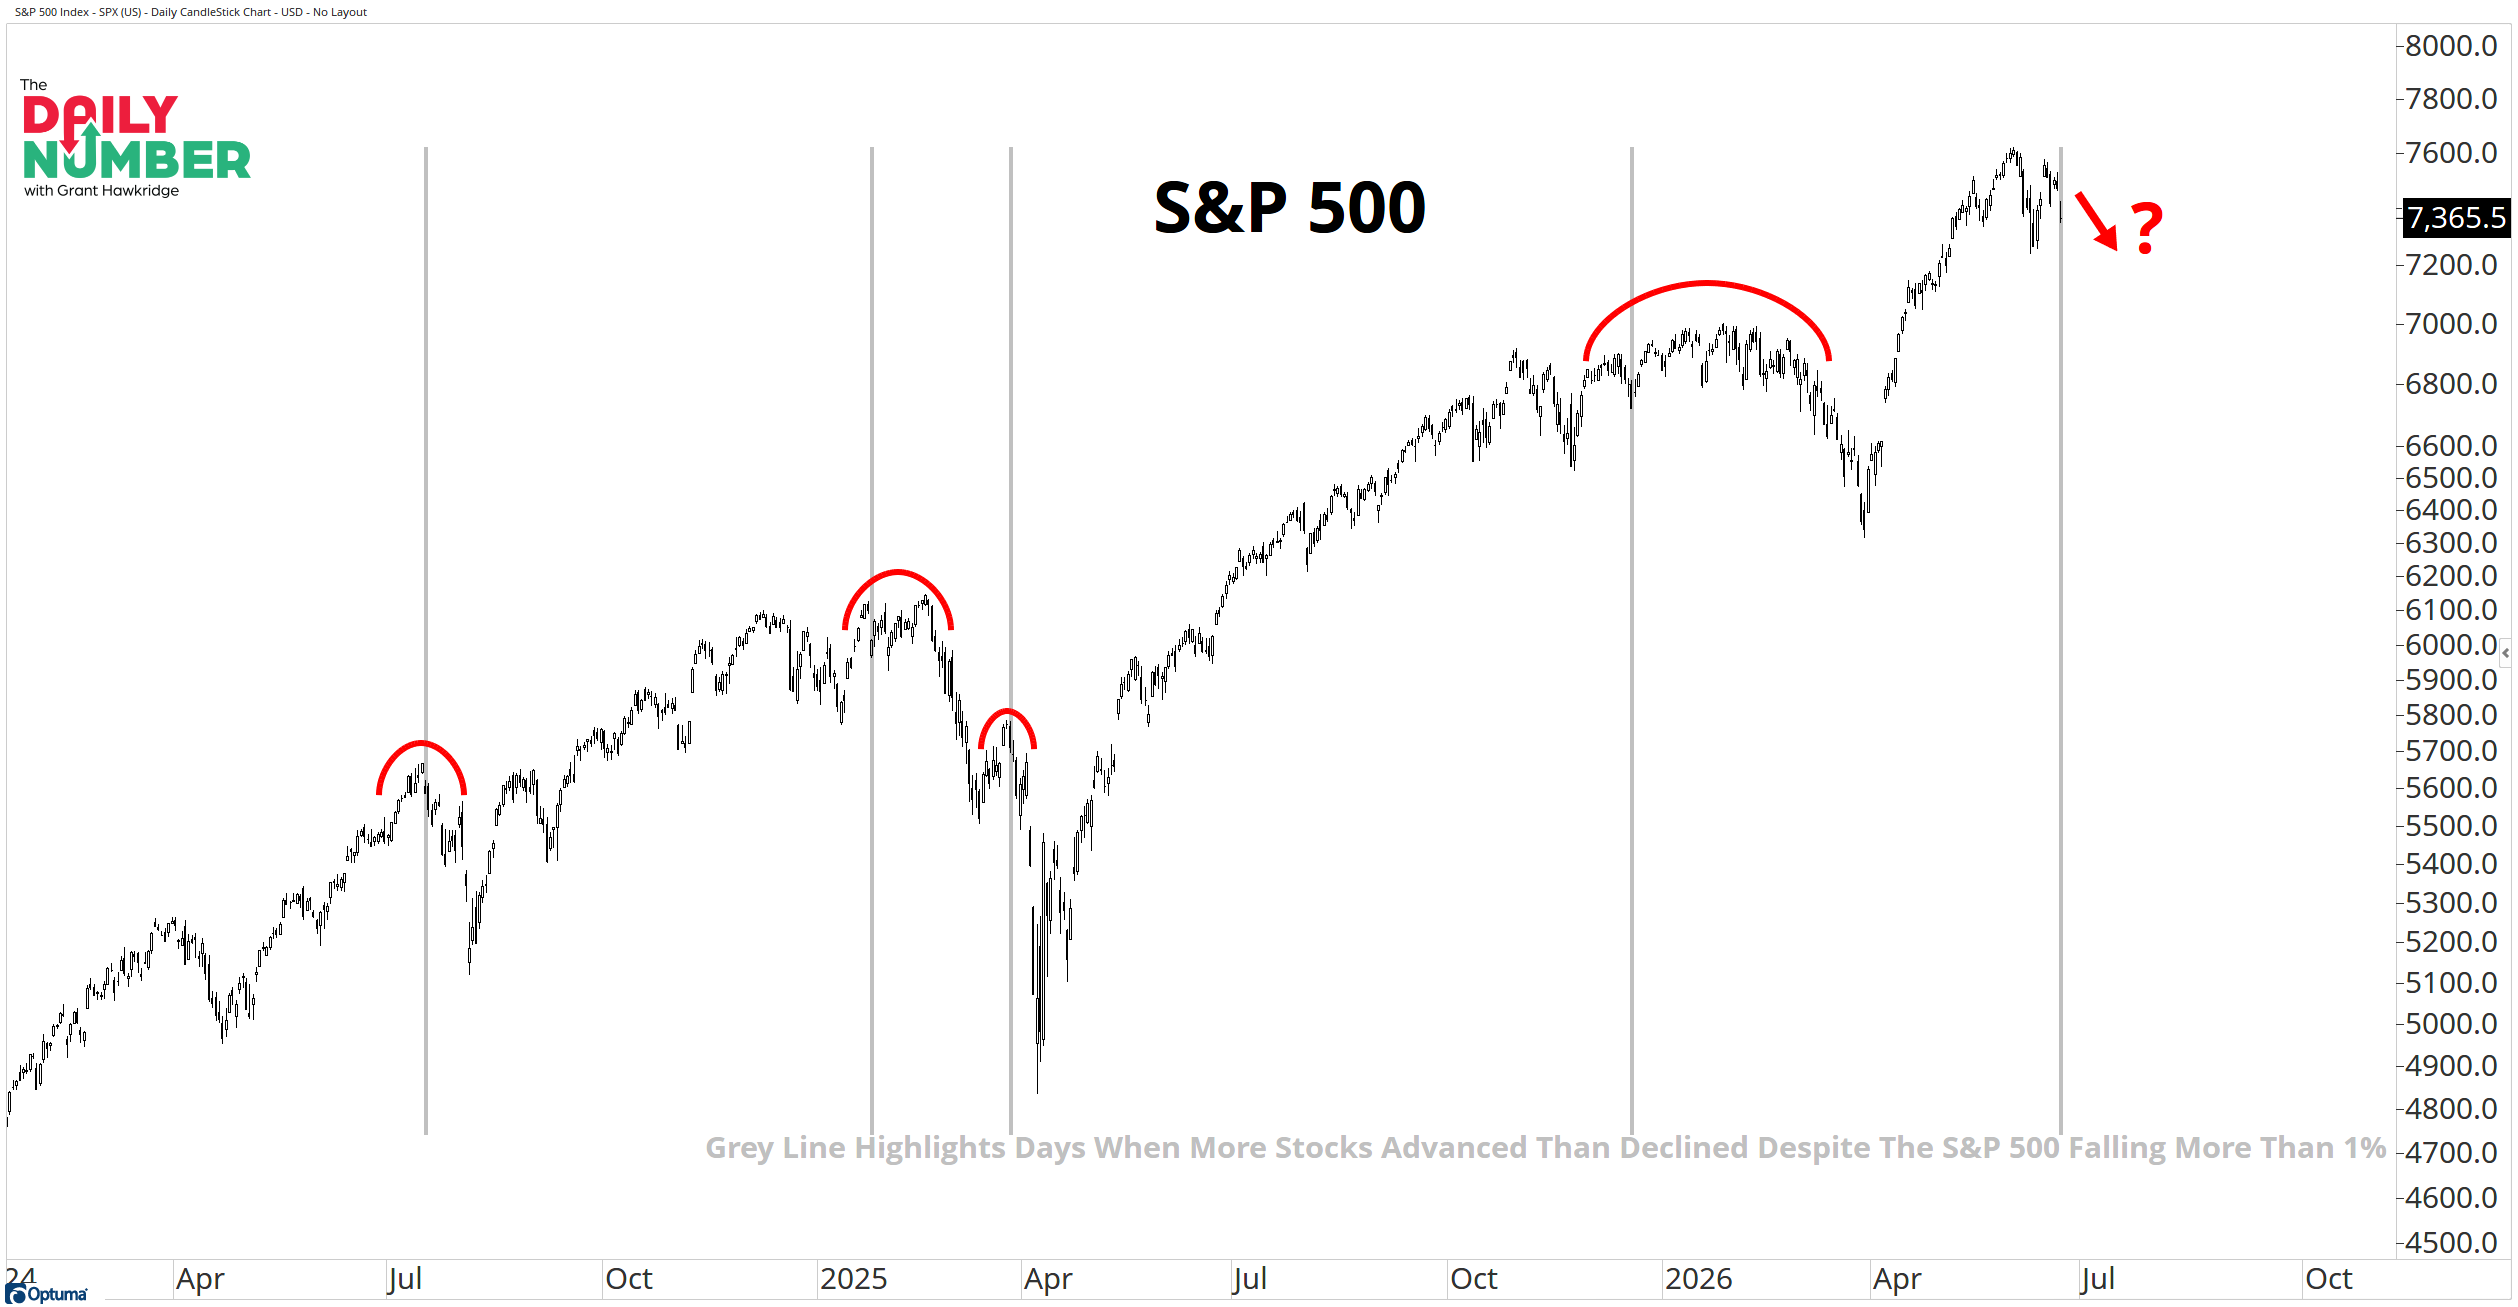
The S&P 500 fell more than 1%, yet more stocks advanced than declined. Those two things do not normally happen together. Most sharp down days are accompanied by broad selling across the market. Yesterday was different.
This signal has only appeared five times since 2003. Most occurred after extended advances, while one appeared during a broader period of weakness. The part that caught my attention wasn't the signal itself. It was the market's response afterwards. Every completed signal was followed by weakness in the weeks ahead. The market did not necessarily peak the next day, but each signal was followed by a period of choppy price action.
The signal exists because the index and breadth are telling different stories. Sharp down days are normally broad-based events. Yesterday, participation remained surprisingly resilient despite the decline in the S&P 500. When price and participation stop moving together, I pay attention.
I'm not changing anything because of this signal.
Five signals since 2003 is not enough data for me to make aggressive decisions based on this signal alone. The sample size is small, but it's not something I can completely ignore either. But every previous signal was followed by weakness in the weeks ahead. That's enough to keep it on my radar.
What I'm watching now is whether this signal starts getting support from other areas of the market. Do new highs begin to contract? Does risk appetite change?
For now, this stays on the watchlist. The signal may be waving a yellow flag, but the weight of the evidence remains bullish.
Grant Hawkridge | Chief Aussie Operator, All Star Charts
Spencer Israel sits across from the entire analyst network every day, hears more good ideas than any one person could ever trade, and picks the ones he likes most.
The SMTV Portfolio is what happens when he puts $10K of his own money behind those calls.