Funny How You Need Participation To Actually Go Somewhere... 👀
By Grant Hawkridge
July 14, 2026
Today's number is... 0.19%
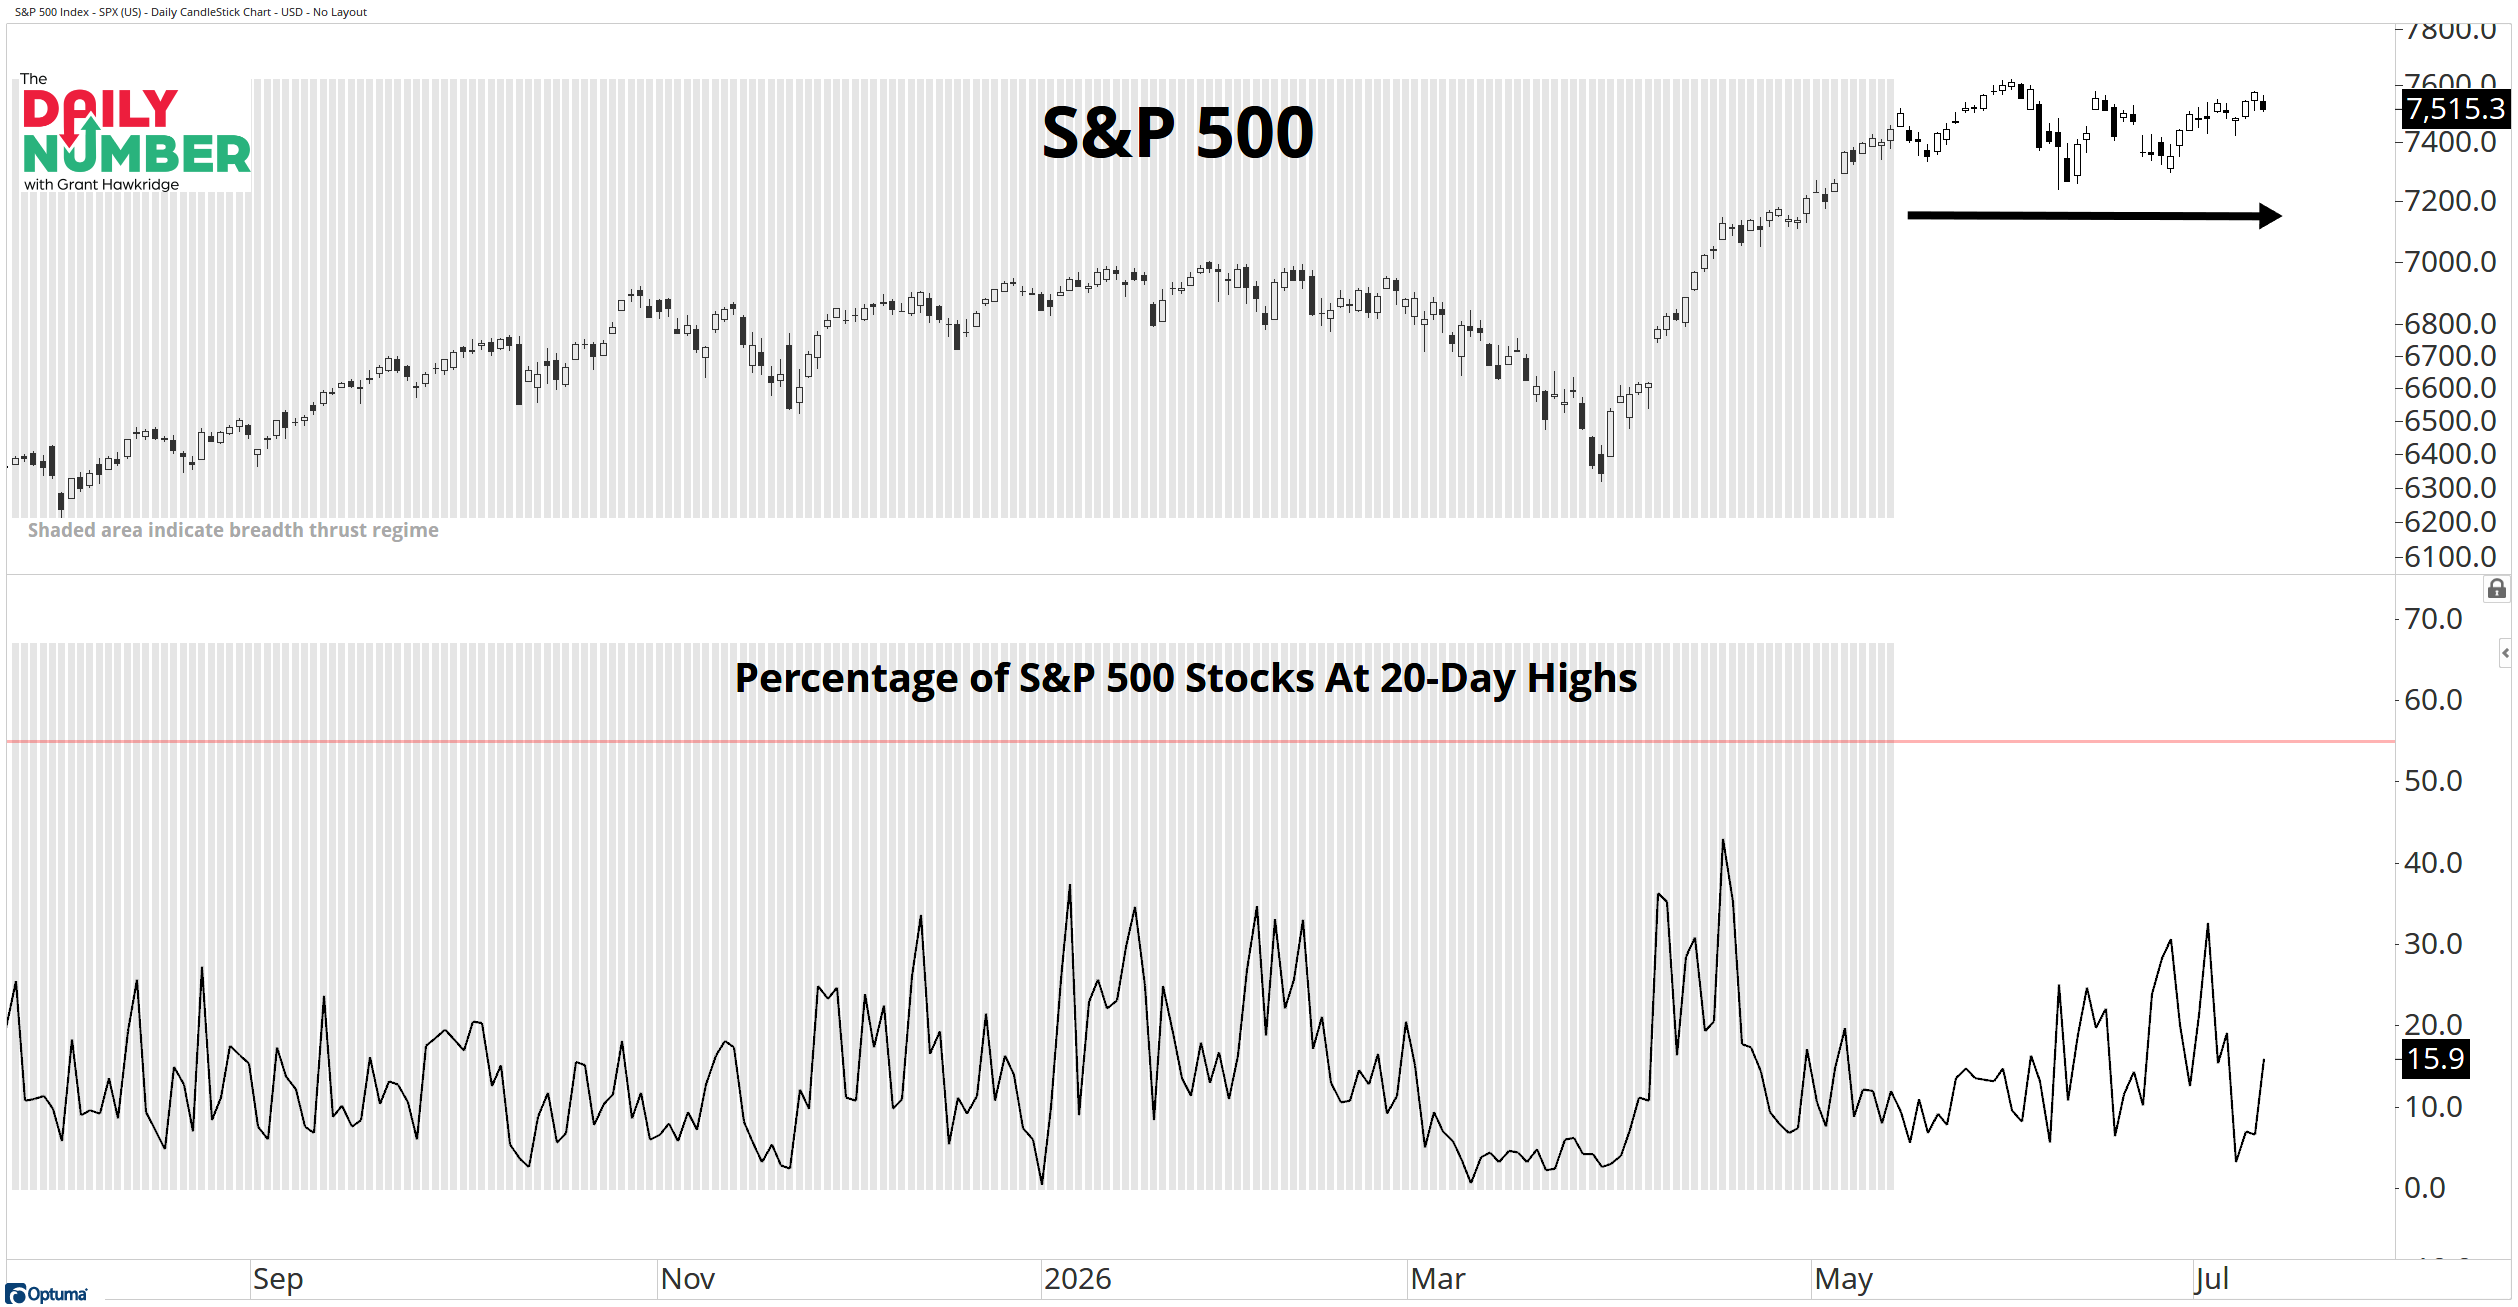
The S&P 500 has gained just 0.19% since the 20-day breadth thrust regime ended on 14 May 2026. The index hasn't fallen apart. It hasn't broken down. It has simply spent the past two months grinding sideways near its highs.
Here’s the chart:
Let's break down what the chart shows:
The top panel shows the S&P 500 in black candlesticks.
The grey shaded area marks the breadth thrust regime.
The lower panel shows the percentage of S&P 500 stocks making 20-day highs as a black line.
The red horizontal line marks the 55% threshold required to trigger a breadth thrust.
The Takeaway: 0.19%.
That's all the S&P 500 has gained since the breadth thrust regime ended on 14 May.
And this is exactly why I keep banging on about participation.
The point was that one of the strongest historical tailwinds behind the market had just disappeared.
And since then?
The S&P 500 has gone nowhere.
It has grinded sideways near record highs and gained just 0.19%.
Funny how you need participation to actually go somewhere.
Because right now, only 15.9% of S&P 500 stocks are making 20-day highs. The threshold for a new breadth thrust is 55%.
We are not even close.
And that 55% level is not some random line I drew on a chart. In my study, every qualifying breadth thrust was followed by a positive 12-month return, with an average gain of 16.8%.
That is why the backdrop matters.
When participation is broad, the market has historically had a powerful tailwind behind it.
When participation fades, price can still hold up. It can still sit near record highs. But making real progress becomes much harder when fewer stocks are coming along for the ride.
So no, the end of the regime did not predict a crash.
It simply warned that the market was losing one of its strongest sources of support.
Two months later, the S&P 500 is up 0.19%.
You can call that coincidence.
I call it a reminder to watch what is happening underneath the index.