0.4% is the S&P 500’s annualized return when the NYSE + NASDAQ Net New High AD Line 10-day average is falling.
This indicator adds together new highs across the NYSE and NASDAQ, subtracts new lows across both exchanges, then tracks the cumulative trend with a 10-day moving average. Put simply, it measures whether the market is consistently producing more new highs than new lows beneath the surface.
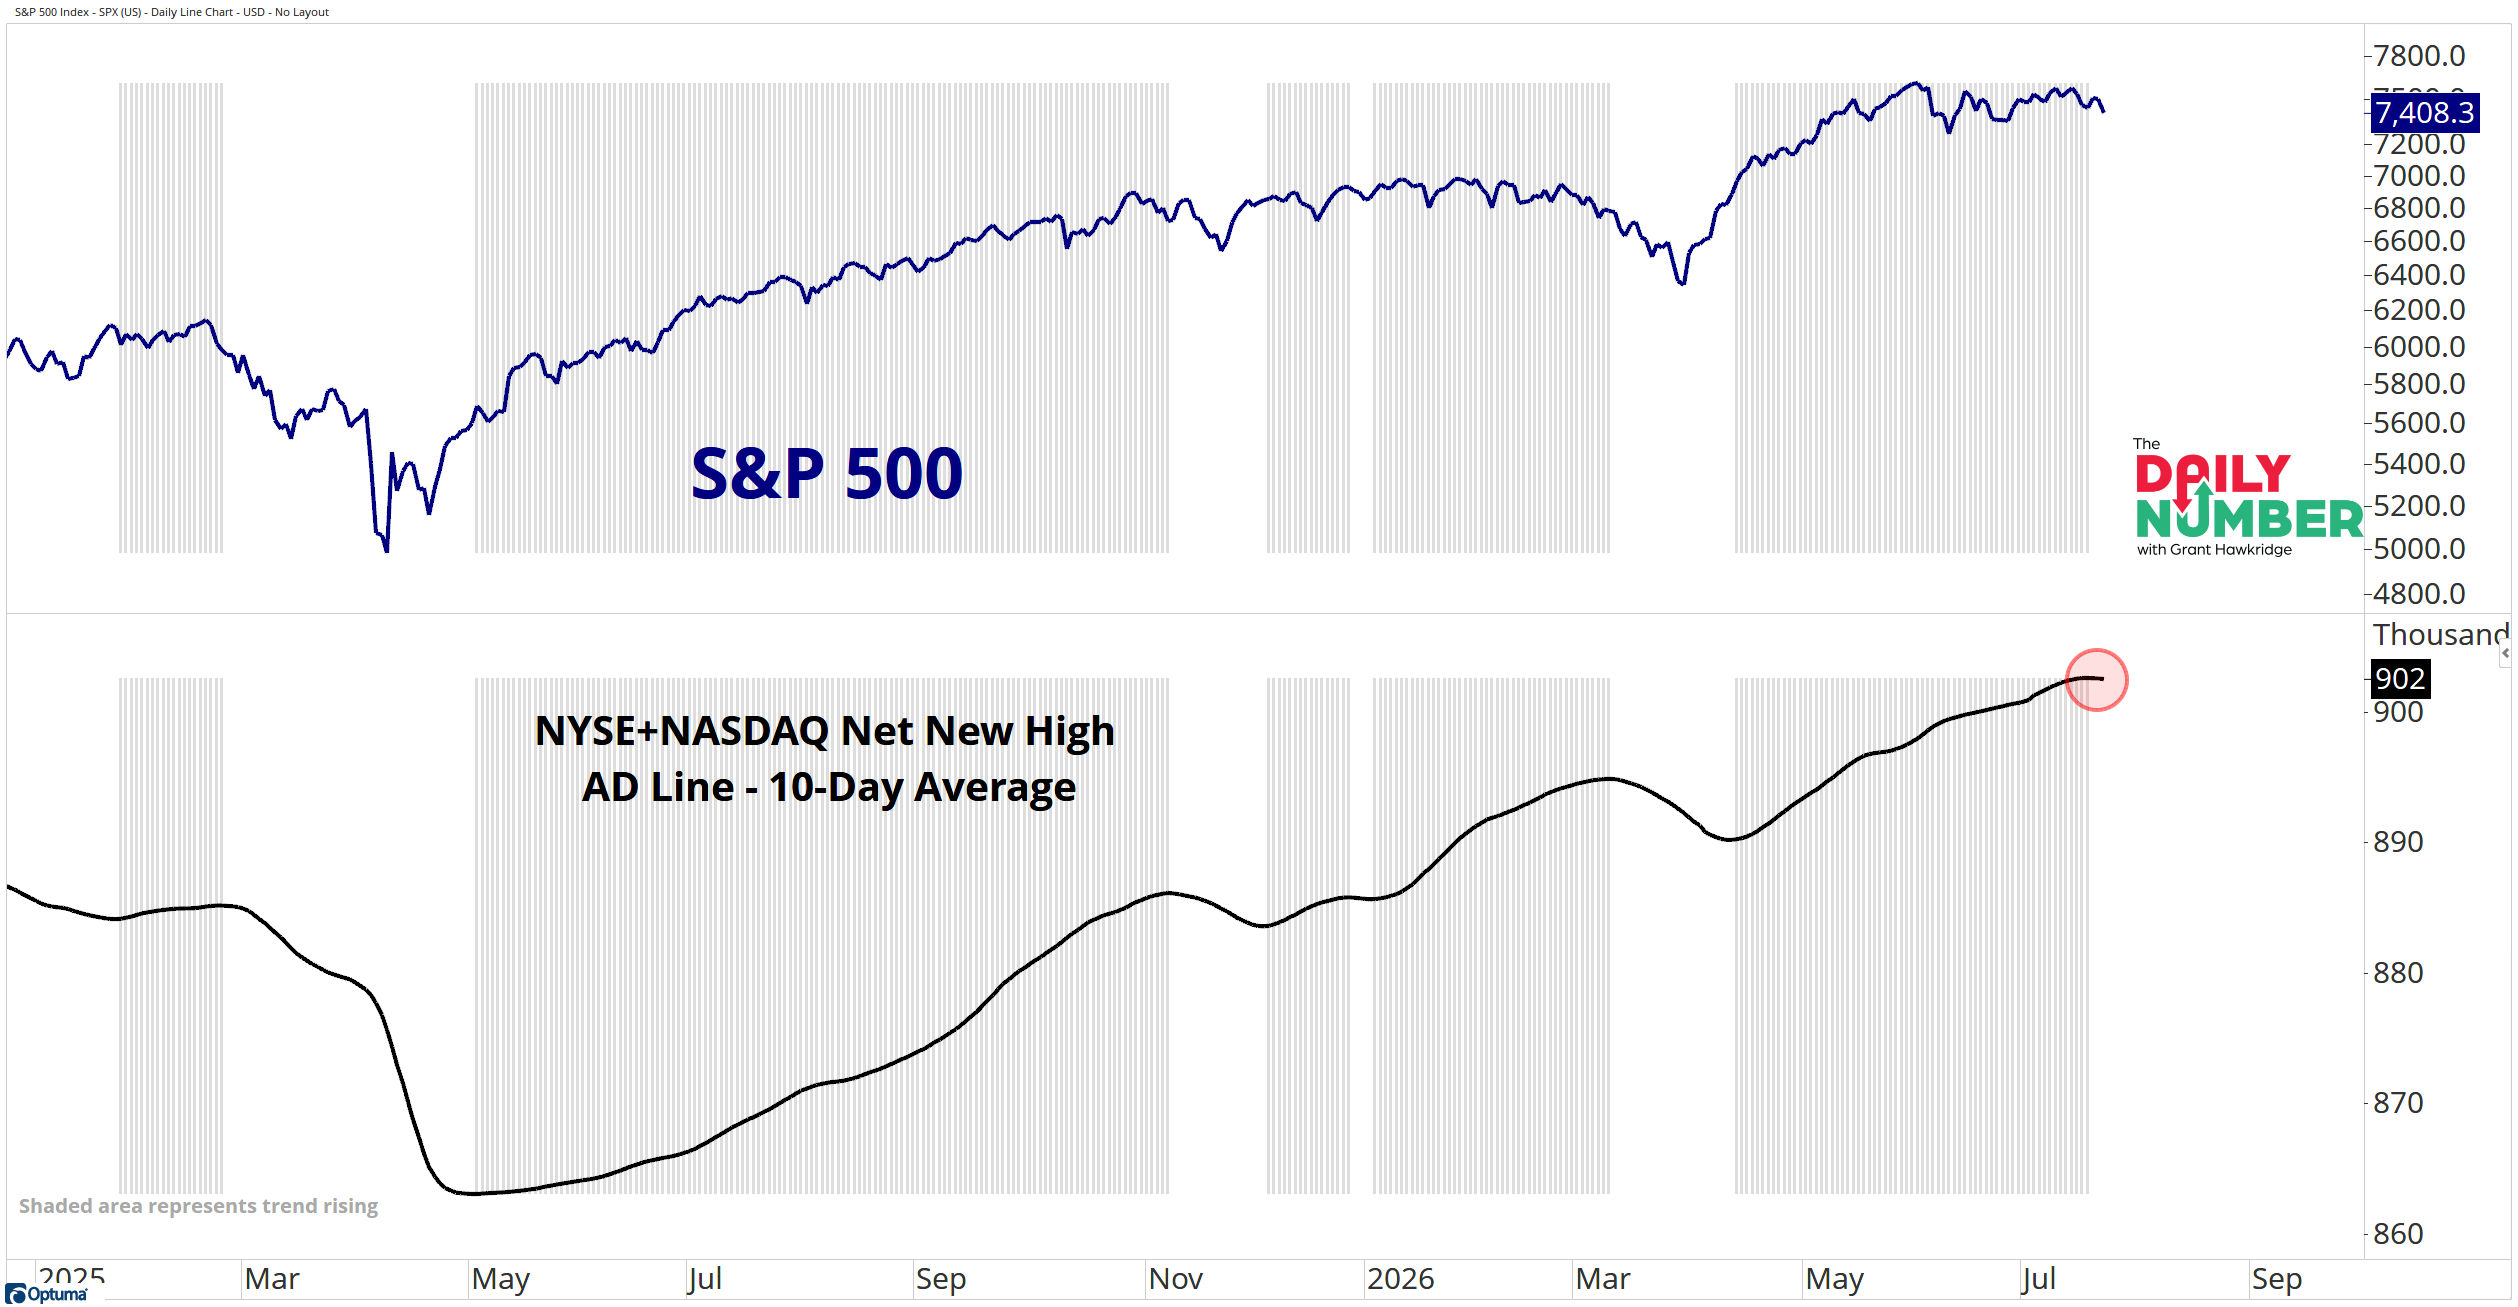
Here’s the chart:
Let's break down what the chart shows:
The blue line in the top panel shows the S&P 500.
The black line in the lower panel shows the 10-day moving average of the NYSE + NASDAQ Net New High Advance-Decline Line.
The gray shading marks periods when the 10-day average is rising.
The Takeaway: The S&P 500 has already spent the past two months going sideways.
That means this breadth shift is not happening while price is powering higher and dragging everything with it. Price has been stalling, and now the participation engine underneath the market has started moving the wrong way.
That is the change.
When this line is rising, the market is producing more new highs than new lows across the NYSE and NASDAQ. More stocks are participating. More areas are working. The broad market has a tailwind.
But when the line starts falling, that advantage begins to shrink.
That is usually where the character change starts.
The historical numbers make the message harder to ignore.
When this breadth trend is rising, the S&P 500 has gained 9.3% annualized since 2000. When it is falling, the return drops to just 0.4%.
That is not a small gap.
And because the S&P 500 has already been moving sideways, the surface message and the internal message now fit together. Price is not saying “strong uptrend.” It is saying “sideways grind.” Breadth is now saying “participation is fading.”
This is not a top call.
It is a regime shift.
When breadth is rising, I can be more forgiving. More stocks can work. Breakouts deserve more room. Broad exposure makes more sense.
But when breadth rolls over while the index is already grinding sideways, I want to be more demanding.
That means staying with leadership, cutting what is losing momentum, and being slower to add exposure until breadth starts improving again.