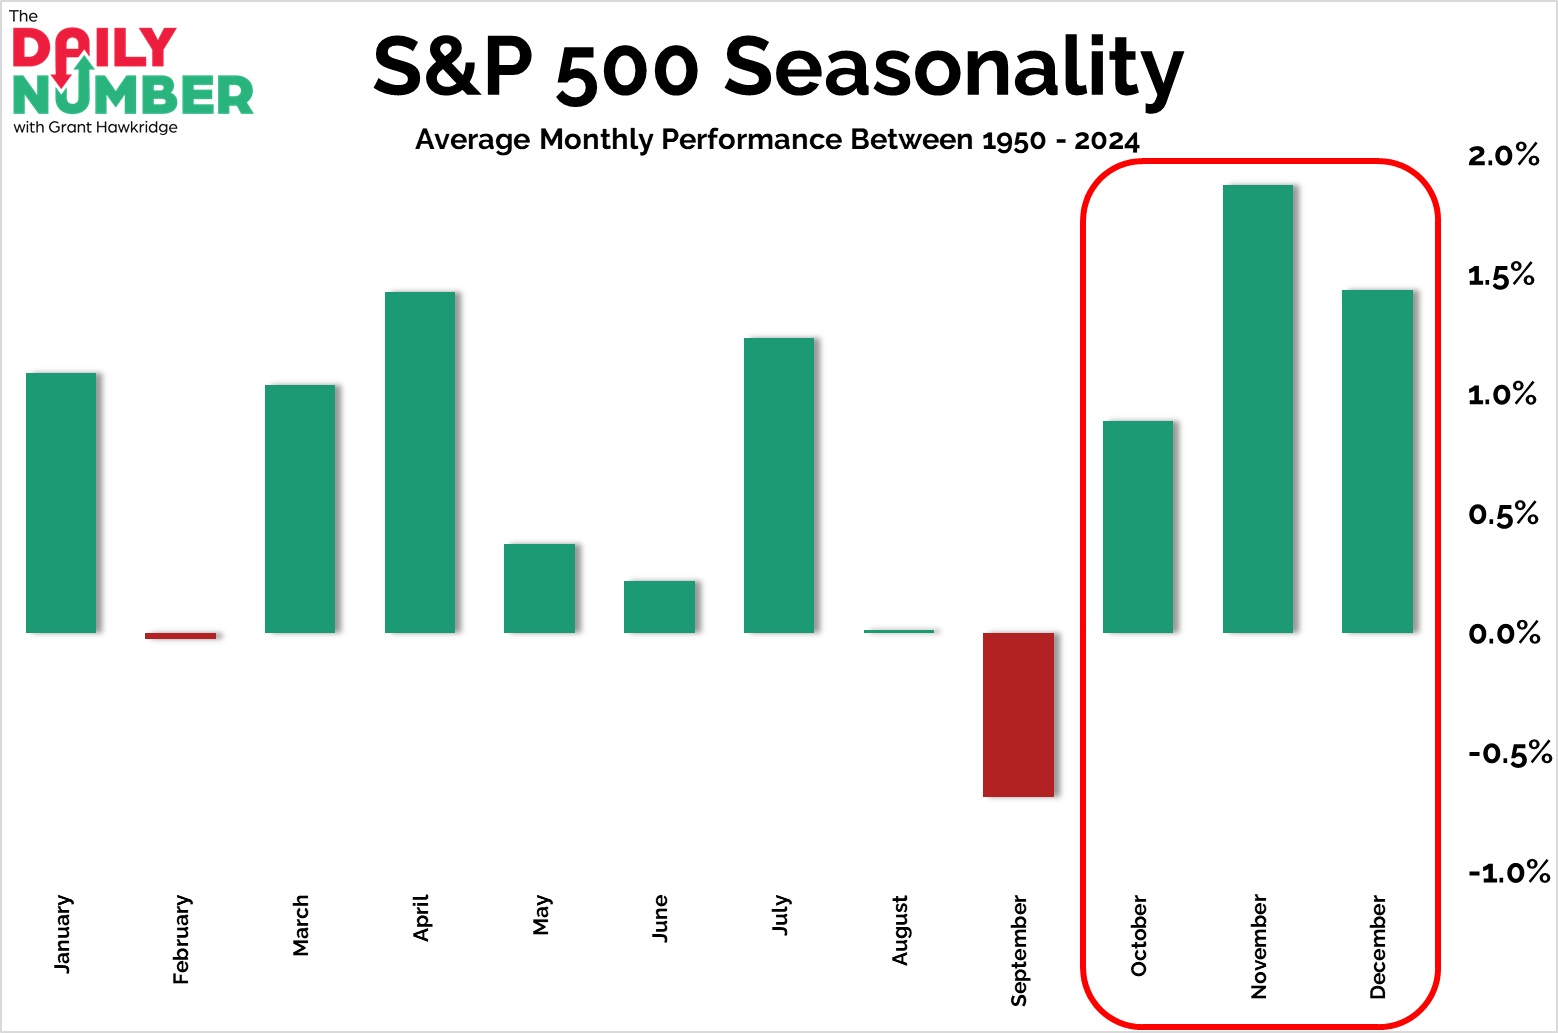
Q4 Is Where Bulls Feast 🐂 By Grant Hawkridge September 30, 2025 Today's number is... 3Three months left. And seasonality points to one of the strongest stretches of the entire year.Here’s the chart: Let's break down what the chart shows:The chart plots the average seasonal path of the S&P 500, with green bars showing positive months and red bars showing negative months.The Takeaway: We are about to enter one of the strongest three-month stretches in the market’s playbook.This isn’t my call. It’s 75 years of market math.October marks the turn, November adds fuel, and December often finishes with the Santa Claus Rally.Each month reinforces the next, creating one of the most reliable runs of the year.This pattern has persisted through every type of backdrop.High inflation and low inflation.Recessions and expansions.Hawkish Fed or dovish Fed.Midterms, elections, or Washington deadlock.The tape has shown the same tendency over and over again.This isn’t a seasonal pattern to shrug off. It’s one of the market’s most reliable edges.The final quarter isn’t about wrapping up. It’s when the market shows its power.History has handed the bulls the ball. What will they do with it?Let me know! Grant Hawkridge | Chief Aussie Operator, All Star ChartsNeed a full trading toolkit that actually helps you make moves?All Star Charts Premium gives you daily trade ideas, proprietary scans, and access to our entire analyst team.If you're serious about leveling up your strategy.Start Here!If you find my content valuable, I would greatly appreciate it if you could share it with your friends, family, and colleagues. Your help in spreading the word is invaluable in supporting our work. Thank you to all of you who share!Sign Up Free For The Daily Number The Daily Number One number. One chart. One insight moving markets today. More from The Daily Number Grant Hawkridge Breadth Is Backing The Bulls 🐂 July 17, 2026 Grant Hawkridge The Mag 7 Are Back At The Line ⚡ July 16, 2026 Grant Hawkridge 300 Days and the Trend Is Still Rising 📈 July 15, 2026 Get the Number That MattersGrant’s Daily Number cuts through the noise to spotlight the single most important data point moving markets right now. You must have JavaScript enabled to use this form. Email Address