The S&P 500 has now closed 200 straight trading days above its 200-day moving average.
Here’s the chart:
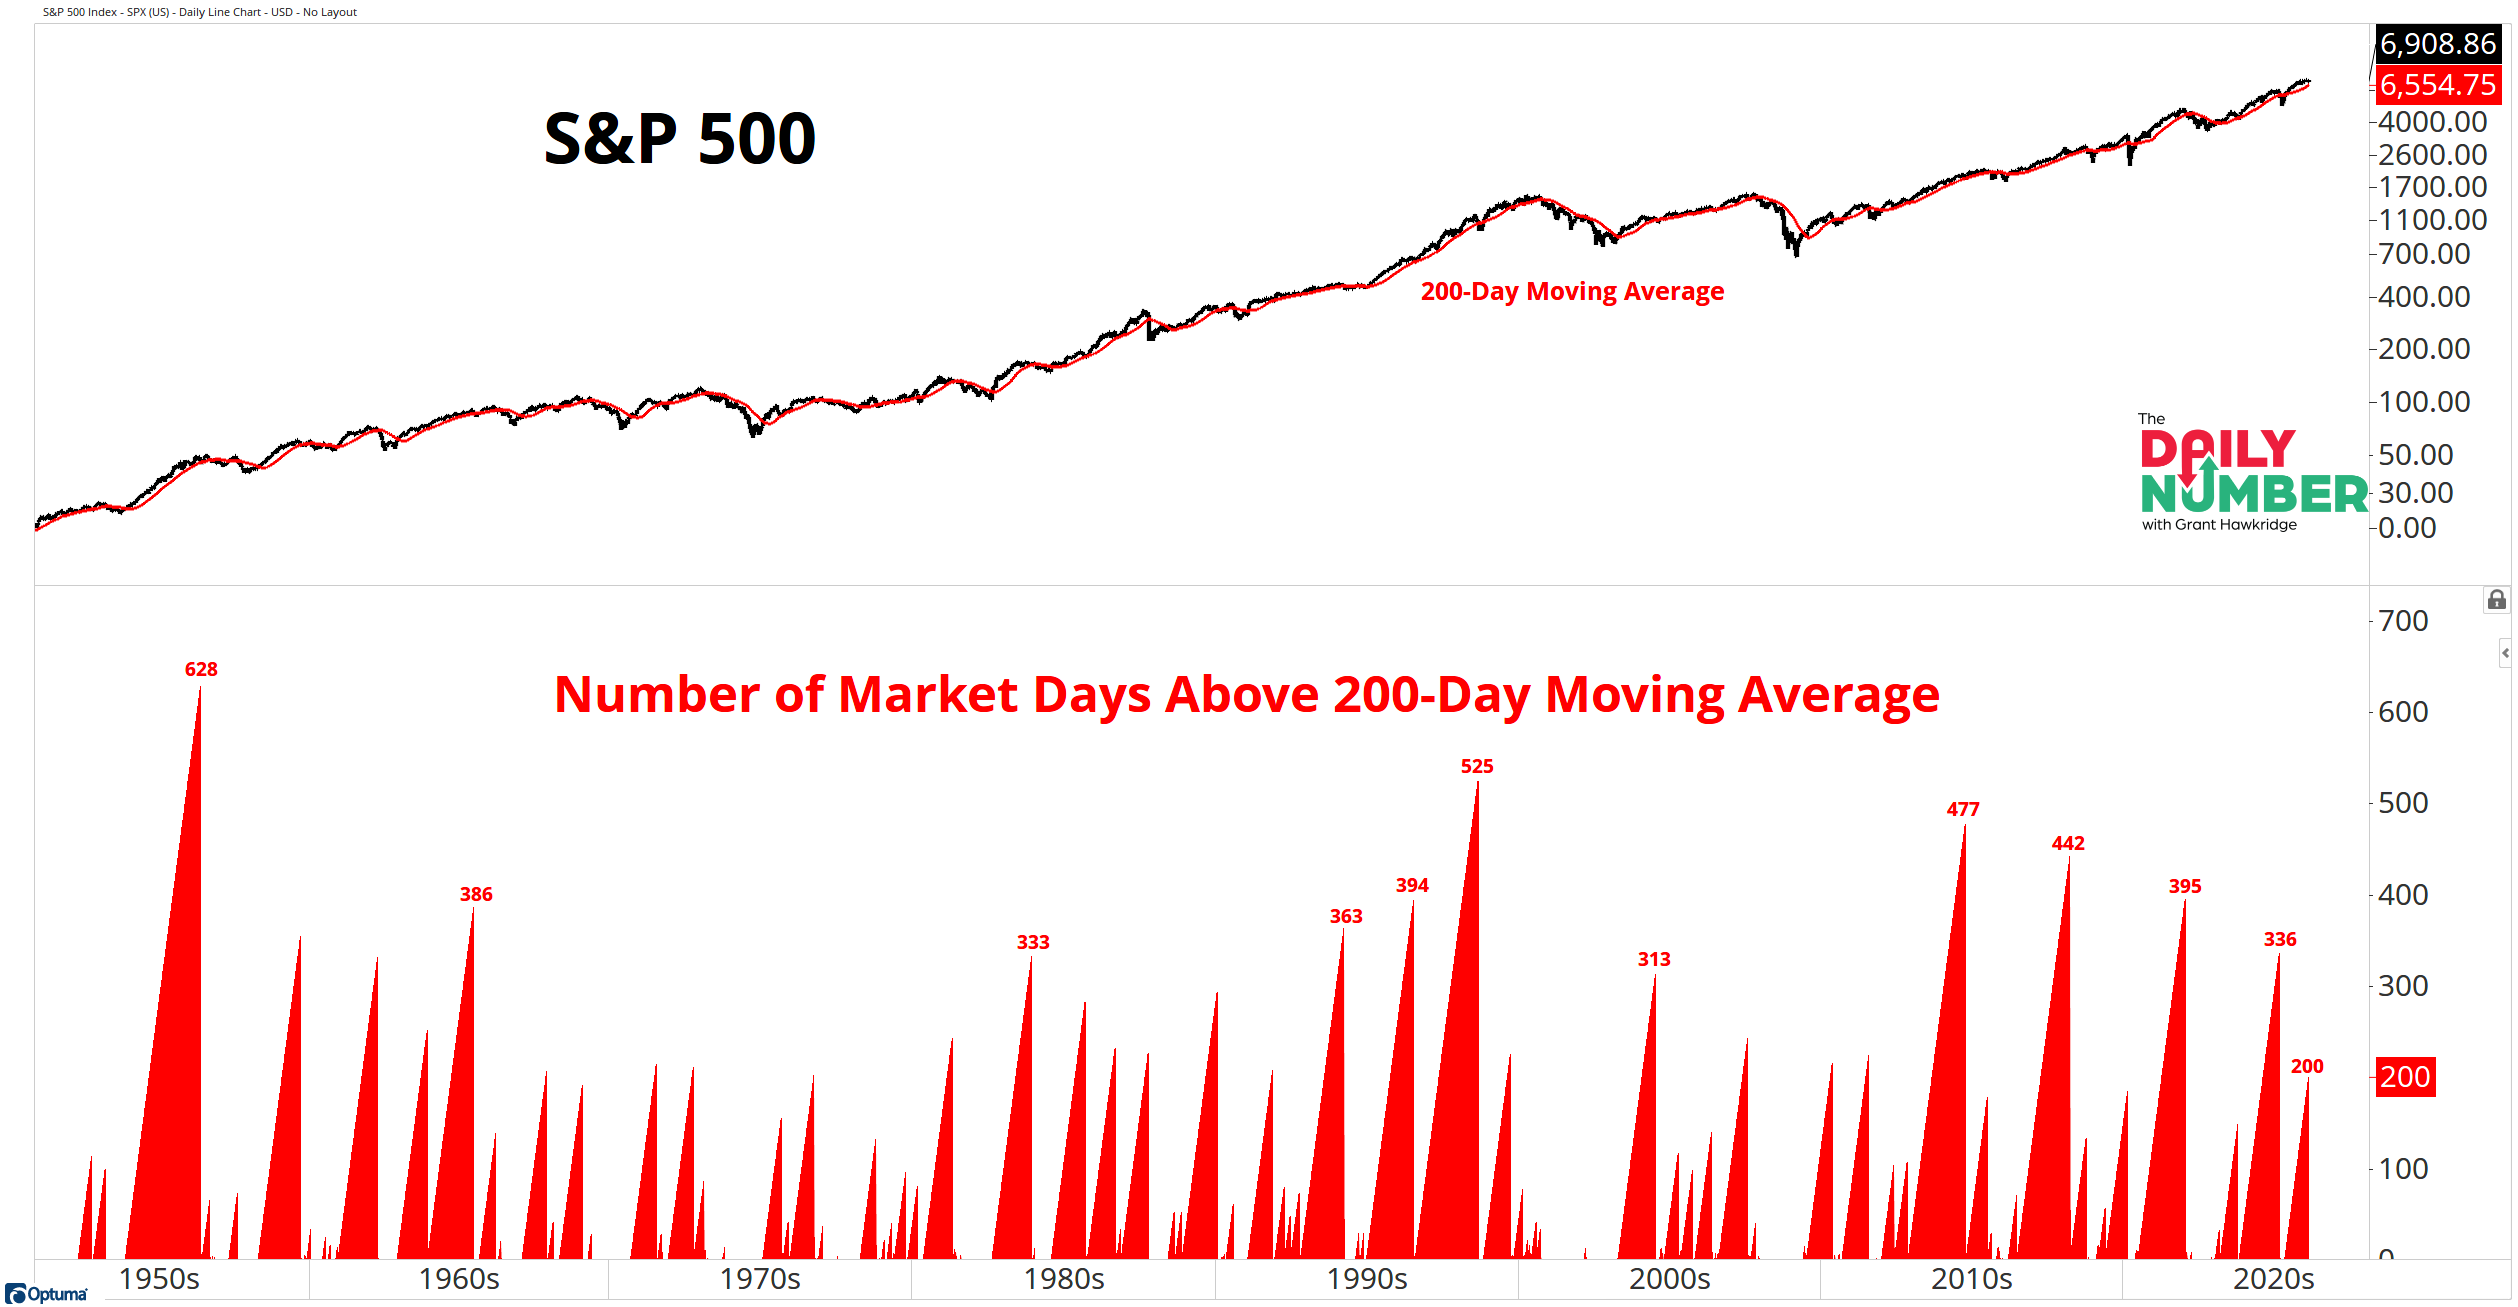
Let's break down what the chart shows:
The top panel displays the S&P 500 in black with a red 200-day moving average.
The lower panel displays red vertical spikes showing the consecutive trading days the index remained above its 200-day moving average.
TheTakeaway: 200 straight days above the 200-day moving average is not random strength.
This is how normal bull markets behave. When the primary trend is up, price lives above the 200-day moving average. Dips find buyers before any real damage is done.
The average run above the 200-day moving average since 1950 is 59.2 days. That average includes bear markets, failed rallies, and choppy resets. Strong markets blow past that number. The current 200-day moving average stretch is more than three times the historical average.
Long streaks do not show up evenly across history. They cluster in powerful bull market phases. Look at the 1950s, the early 1990s, the 2010s. Buyers kept pressing. Pullbacks stayed shallow. Sellers could not push price below long-term trend.
This current streak ranks 29th-longest since 1950. It is extended, but nowhere near the extreme levels we have seen in the past. Bull markets can grind much longer than most expect.
As long as price stays above a rising 200-day moving average, the primary trend is up.
200 days above trend keeps the bull case intact. So, what breaks the streak?