Emerging Markets broke above an 18-year ceiling and are pushing to fresh all-time highs.
Here’s the chart:
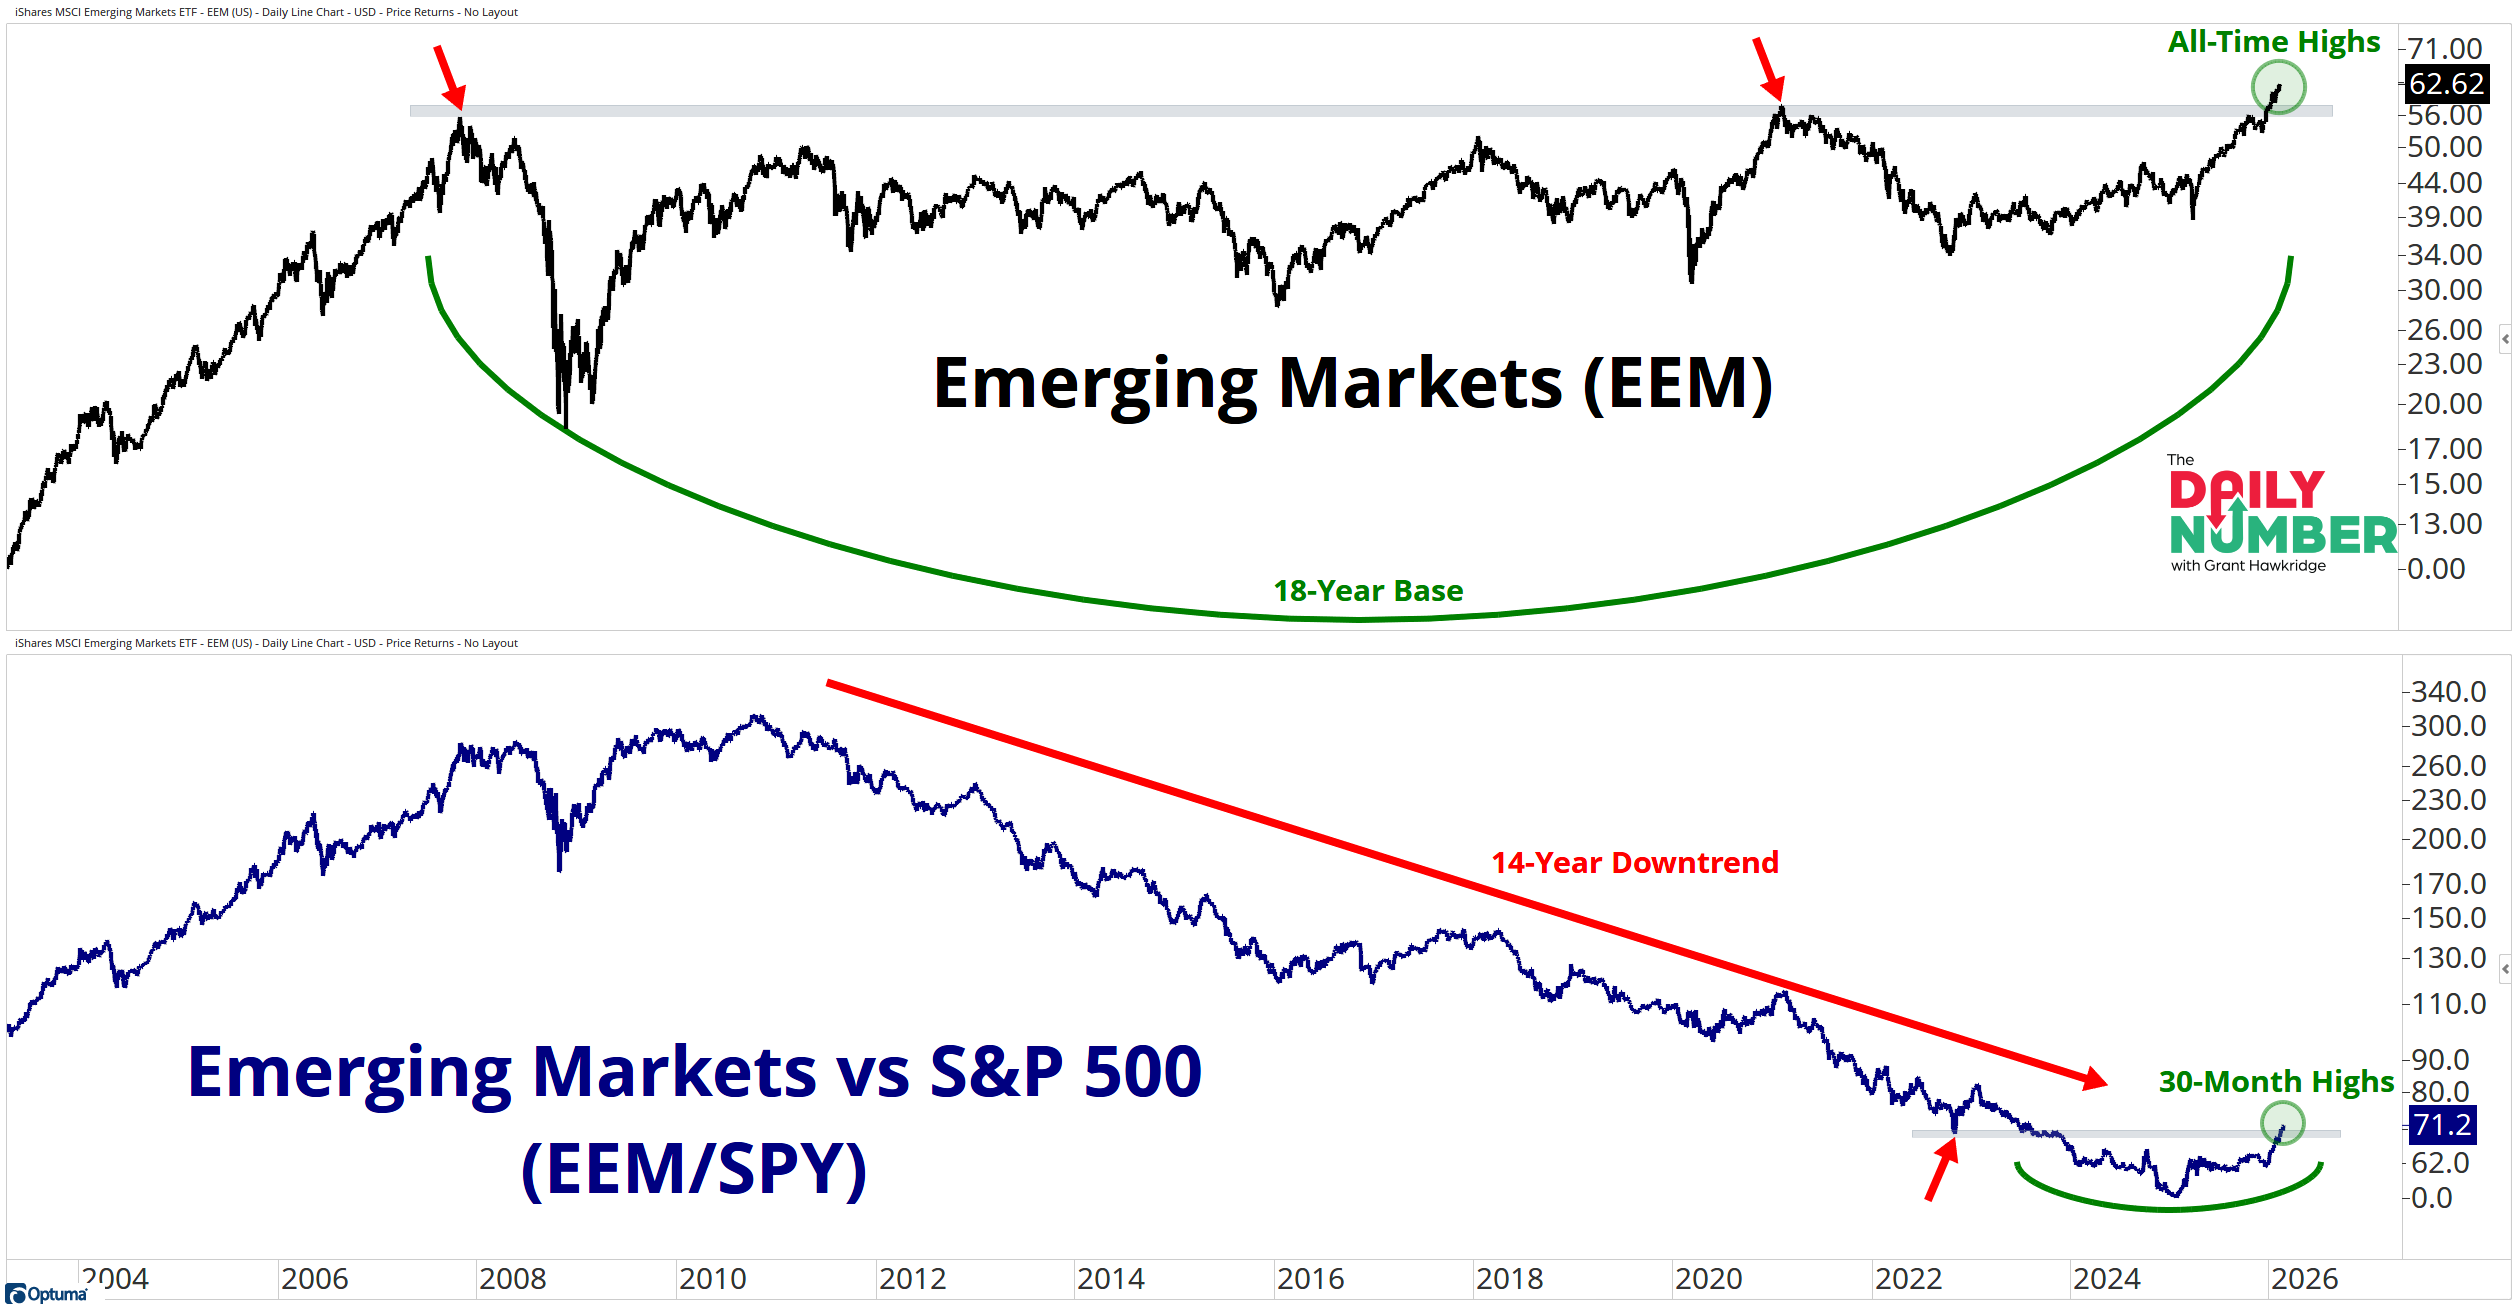
Let's break down what the chart shows:
The top panel displays Emerging Markets in black.
The bottom panel displays Emerging Markets relative to the S&P 500 in blue.
TheTakeaway: Emerging Markets cleared an 18-year ceiling in January and are pressing into new all-time highs again yesterday.
Price went sideways for nearly two decades. That level is now behind us. When a range this big breaks, it's not just a simple trade. It is a cycle shift. The measured move from that 18-year range targets roughly $180. The bigger the base, the higher in space, and 18 years is not small. Moves built over this long do not resolve quietly.
The relative chart backs up the absolute price breakout.
Emerging Markets versus the S&P 500 just hit a 30-month high and broke out of a 3-year bearish-to-bullish reversal pattern. The 14-year run of steady underperformance has stalled and it looks like the leadership is now rotating.
This is risk-on behavior. Money is pushing further out the curve. The US dollar has been under pressure. Commodities are participating. Emerging Markets do not trade at all-time highs in defensive environments.
An 18-year range is finished.
A 3-year relative reversal is breaking higher.
I think that the rotation is well underway.
So, did the train leave the station, or is it still boarding?