The S&P 500 Equal Weight Index is up 6.3% year-to-date and is beating every single Magnificent 7 name.
Here’s the table:
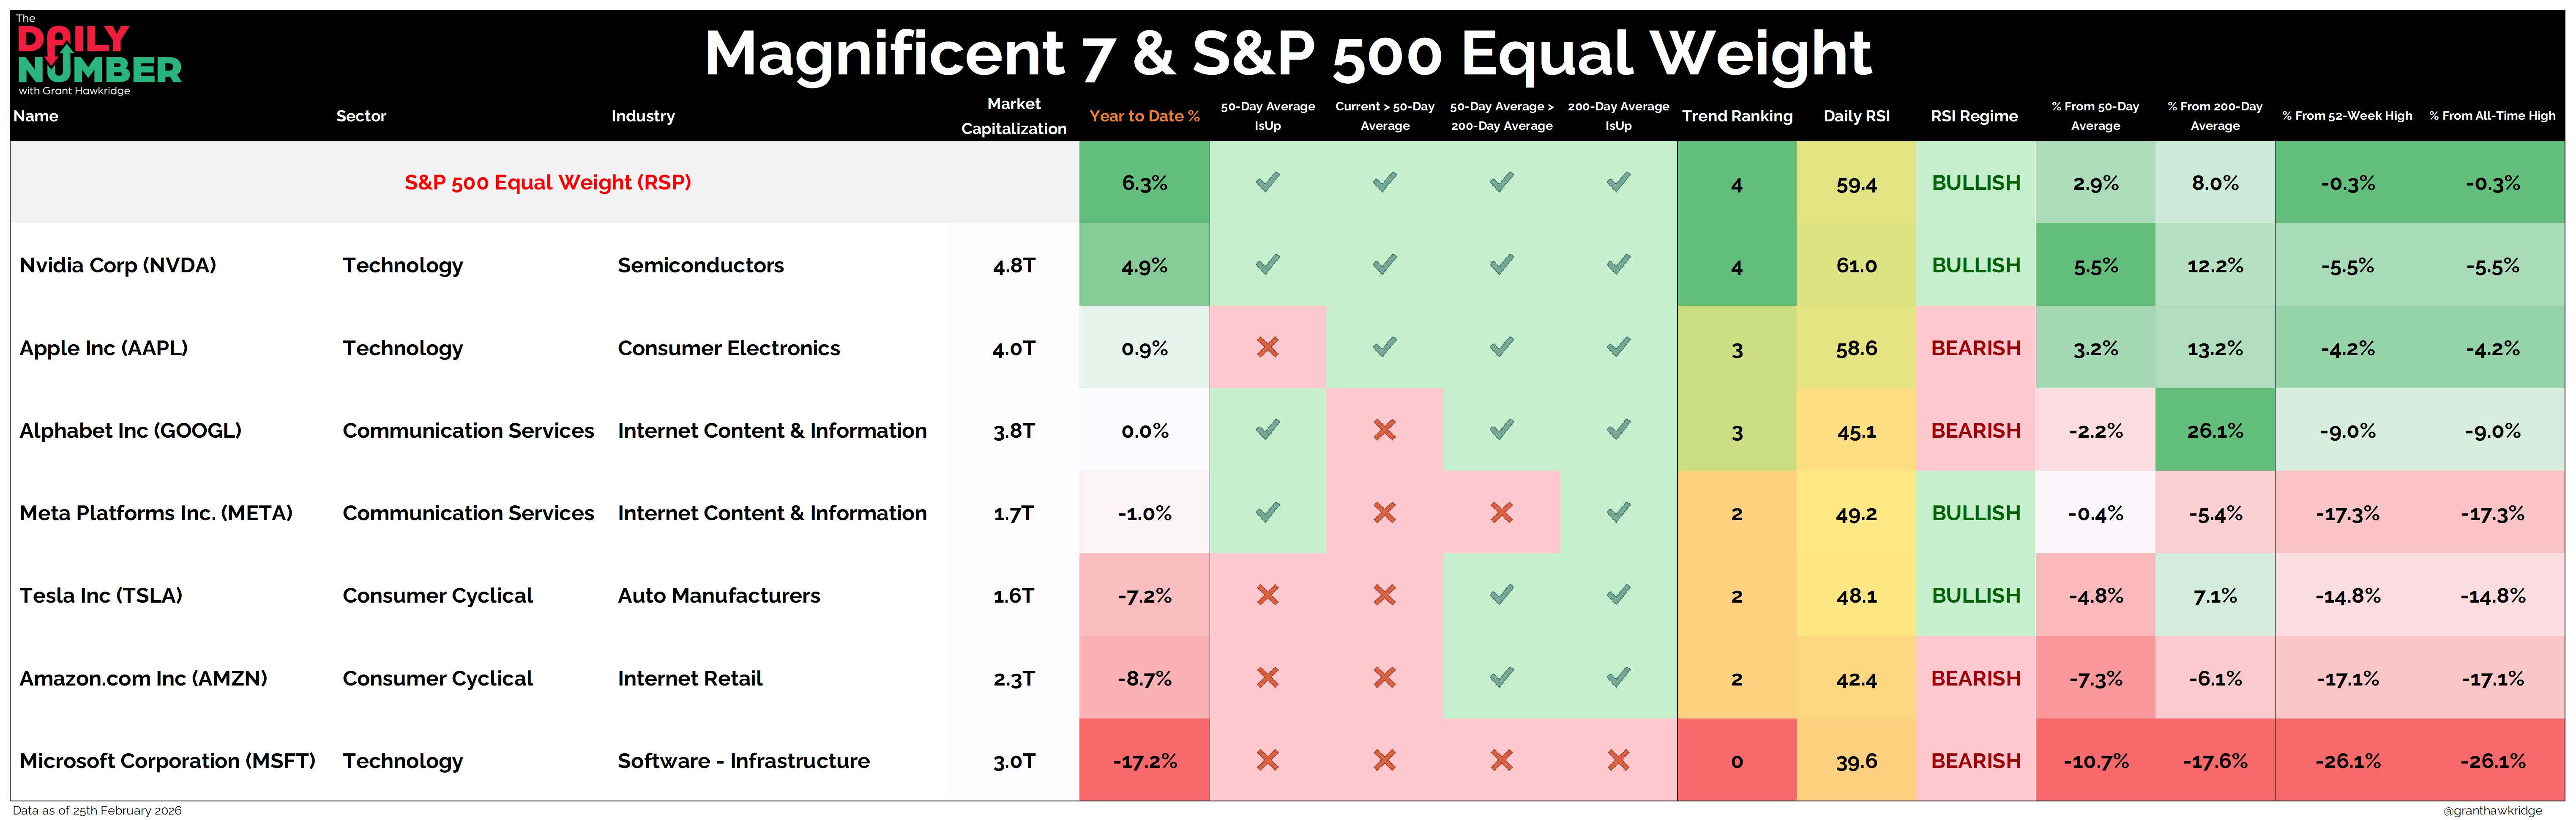
Let's break down what the table shows:
The table lists the S&P 500 Equal Weight Index and the Magnificent 7 stocks.
Each row includes Year to Date %, trend checks for the 50-day and 200-day averages, a Trend Ranking score, Daily RSI, RSI regime, and percentage distance from key moving averages and highs.
TheTakeaway: Equal weight is leading the mega caps.
The S&P 500 Equal Weight Index is up 6.3% year-to-date and sits just shy of its all-time high. Every single Magnificent 7 stock trails that return.
The leadership base is wider this year. Gains are not concentrated at the very top of the index. More stocks are contributing to performance. The rally is not being carried by only seven stocks. It is being supported across the whole list. When returns are spread out like this, the market does not depend on one group staying hot.
Nvidia is the only one really keeping it close. Nvidia is up 4.9% year-to-date and remains above its key trend levels. It looks better than the rest of the Magnificent 7 group, but it is still trailing the average stock.
Microsoft is the clear laggard. Microsoft is down –17.2% year-to-date and sits –26.1% below its all-time high. That is not a small dip. That is real damage to one of the largest stocks in the world.
Last year, you could hide in the biggest names and outperform. This year that trade is not enough. The average stock is beating every one of them. Owning size alone is no longer the edge.
So, are you still anchored to the biggest names, or are you trading the stocks that are actually outperforming?