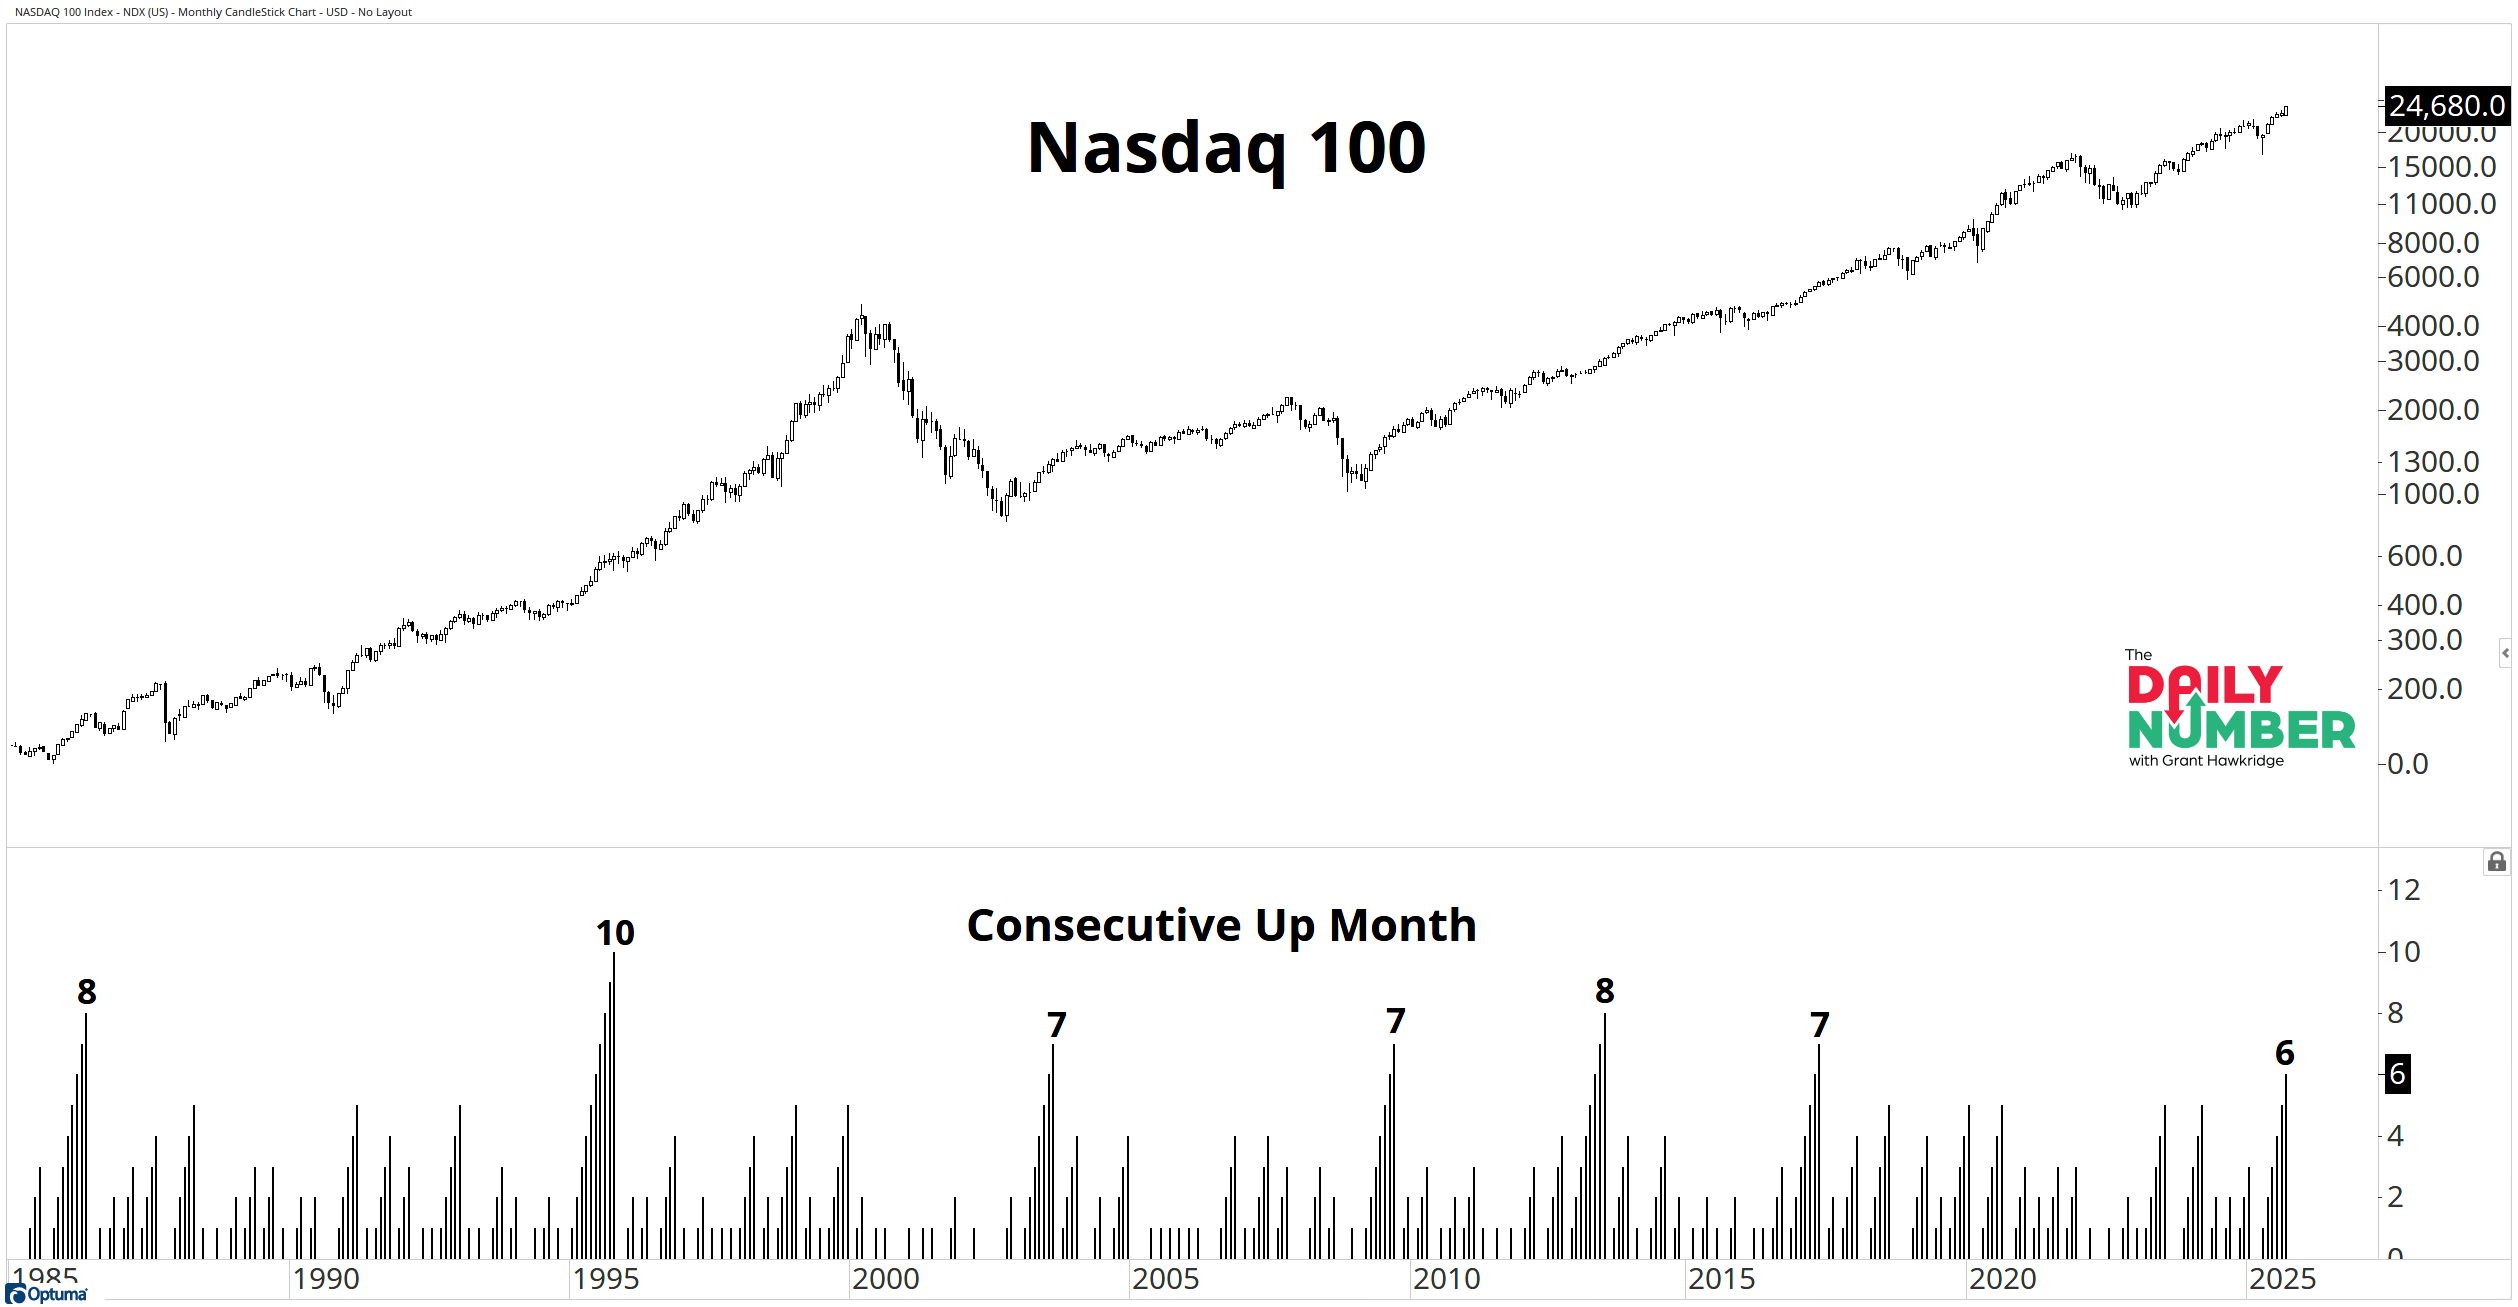
The Nasdaq 100 has just posted six consecutive months of gains. That’s the longest winning streak in over seven years.
Here’s the table:
Let's break down what the table shows:
The top panel shows the monthly chart of the Nasdaq 100.
The bottom panel tracks consecutive monthly gains.
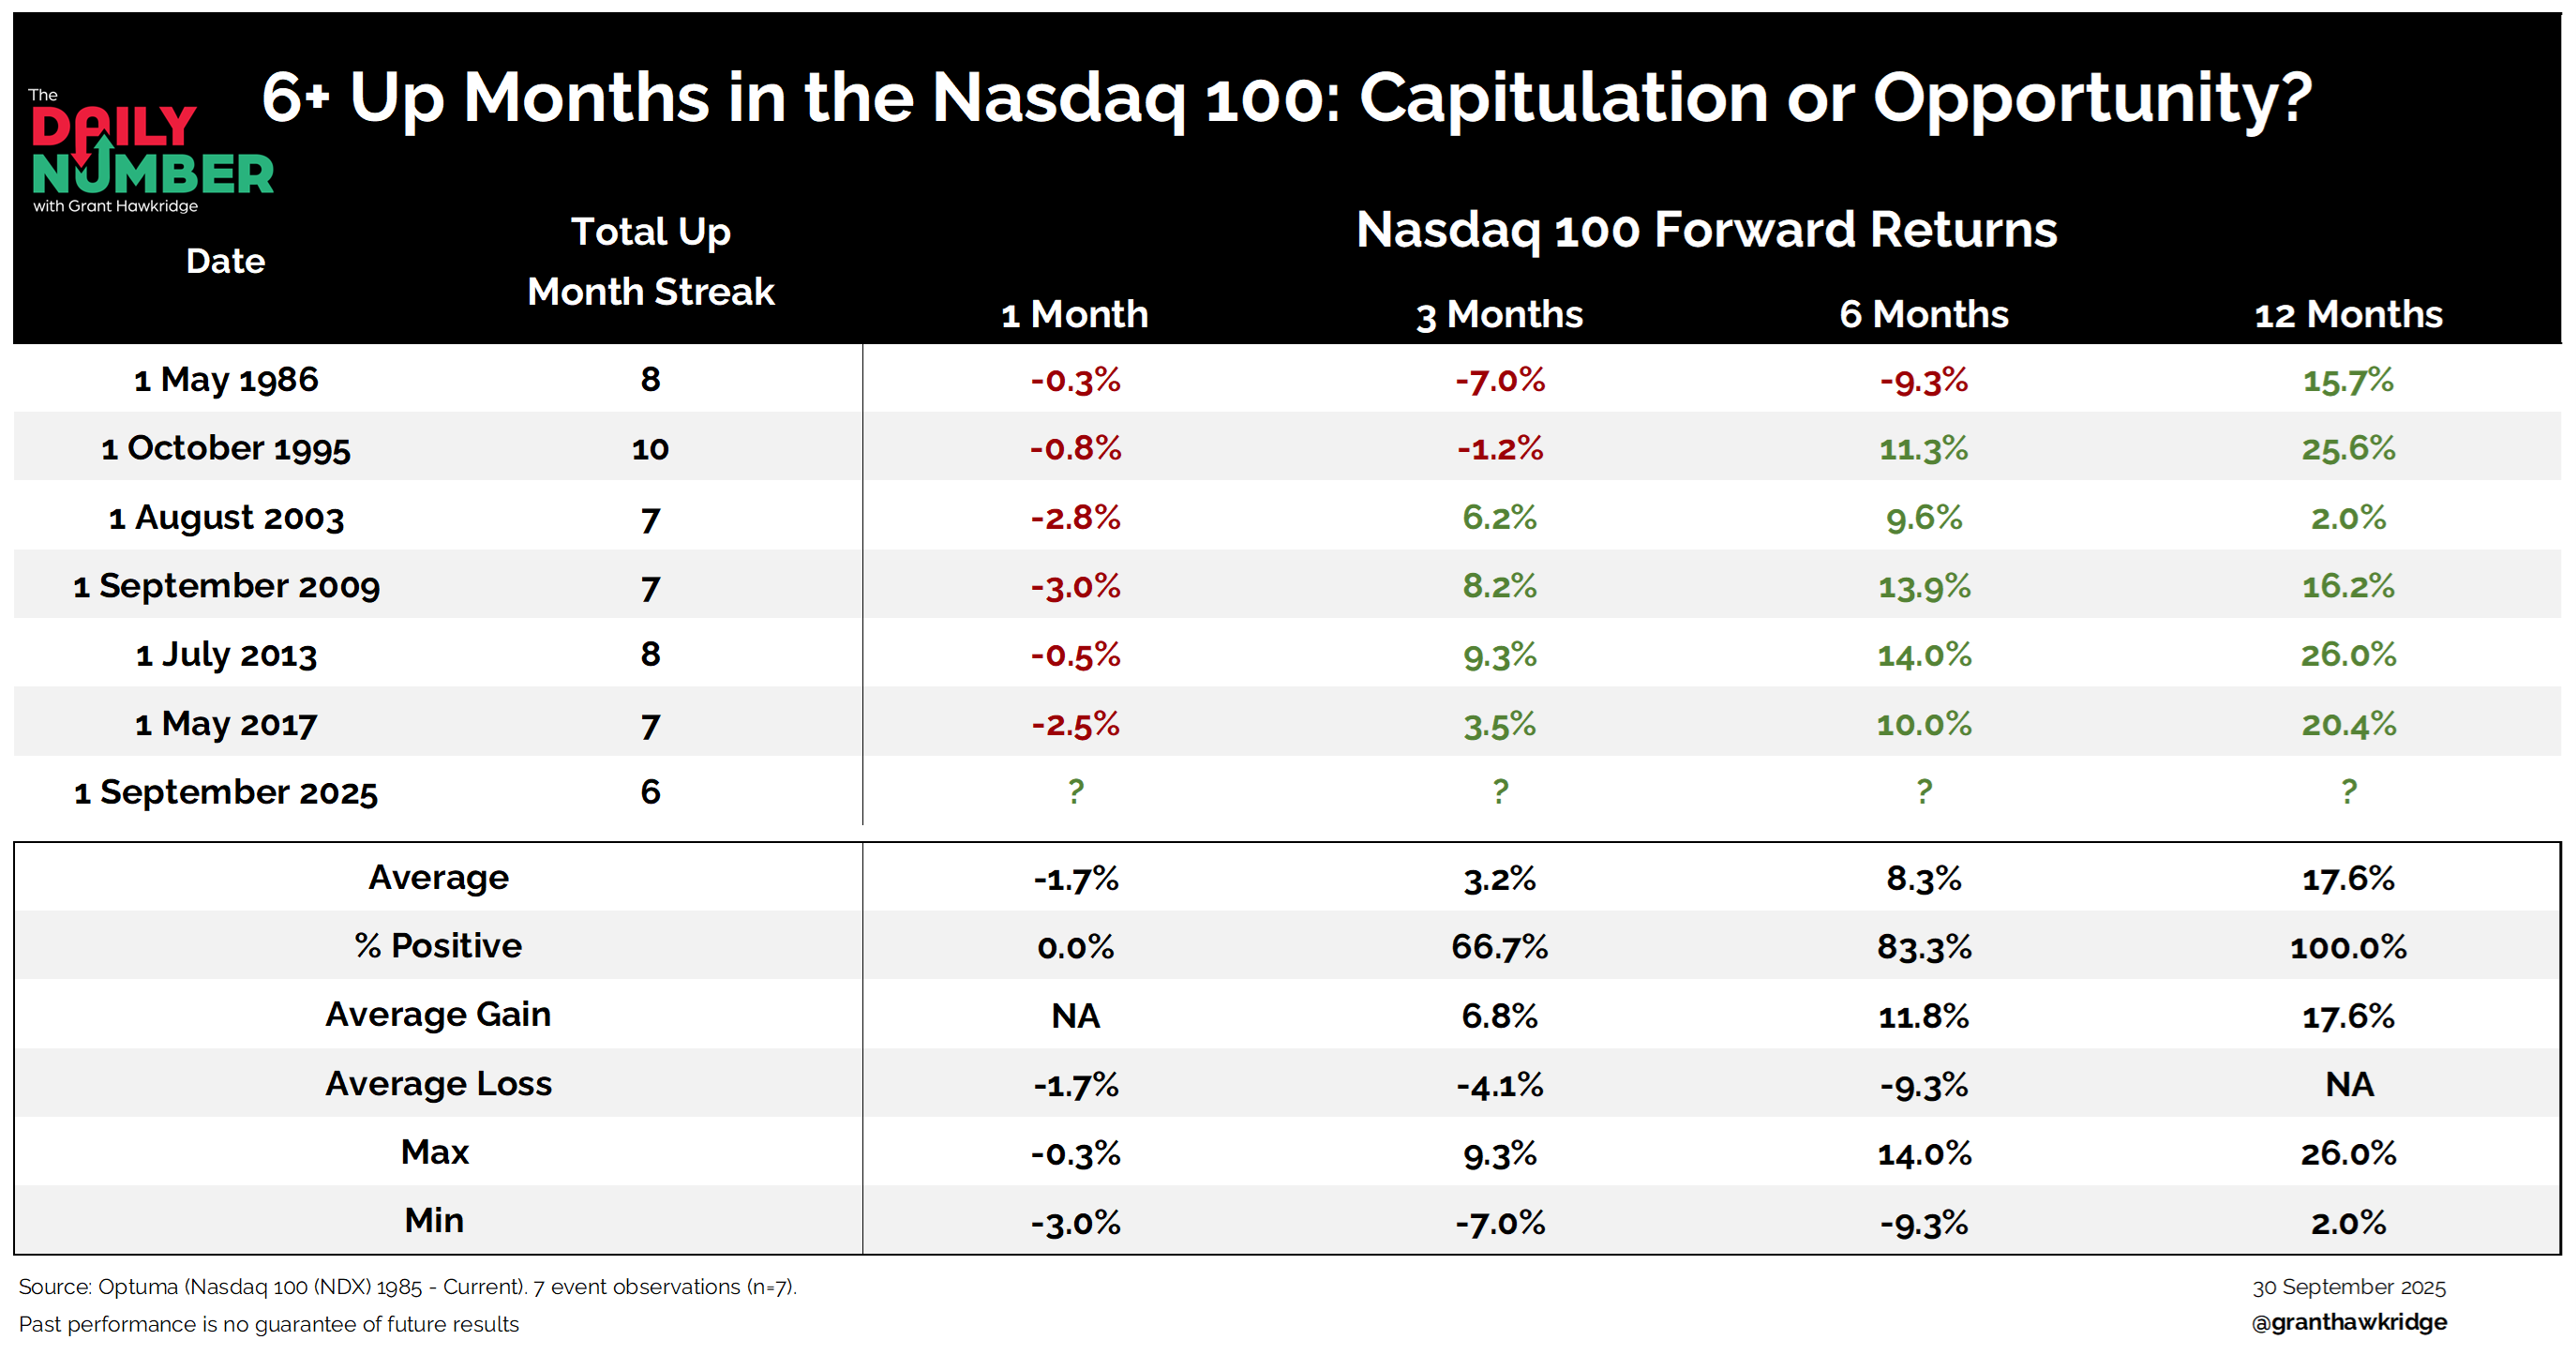
The table shows the forward returns after each of those streaks. It highlights performance one, three, six, and twelve months later.
The Takeaway: Six or more straight monthly gains are rare.
This is the first streak of this length since 2017, and the history is clear: strength tends to beget more strength. Across the six prior cases since 1985, the Nasdaq 100 was higher a year later every single time, with an average return of 17.6%.
Each one occurred inside a major bull market. This kind of consistency is hard to ignore.
These streaks do not show up randomly. They aren’t signs of exhaustion. They are signs of persistent demand inside strong bull market phases. Momentum like this usually resolves higher, not lower.
If the trend follows the script, the next big move may not be done. What if this streak is the start of something much bigger?
Grant Hawkridge | Chief Aussie Operator, All Star Charts
If you’re interested in a full portfolio of small-cap trade ideas, take advantage of the special offer and sign up for All Star Charts premium risk-free today.
If you find my content valuable, I would greatly appreciate it if you could share it with your friends, family, and colleagues. Your help in spreading the word is invaluable in supporting our work. Thank you to all of you who share!