The S&P 500 has made 30 all-time highs in 2025. That’s already well above the historical average of 19.7 per year.
Here’s the table:
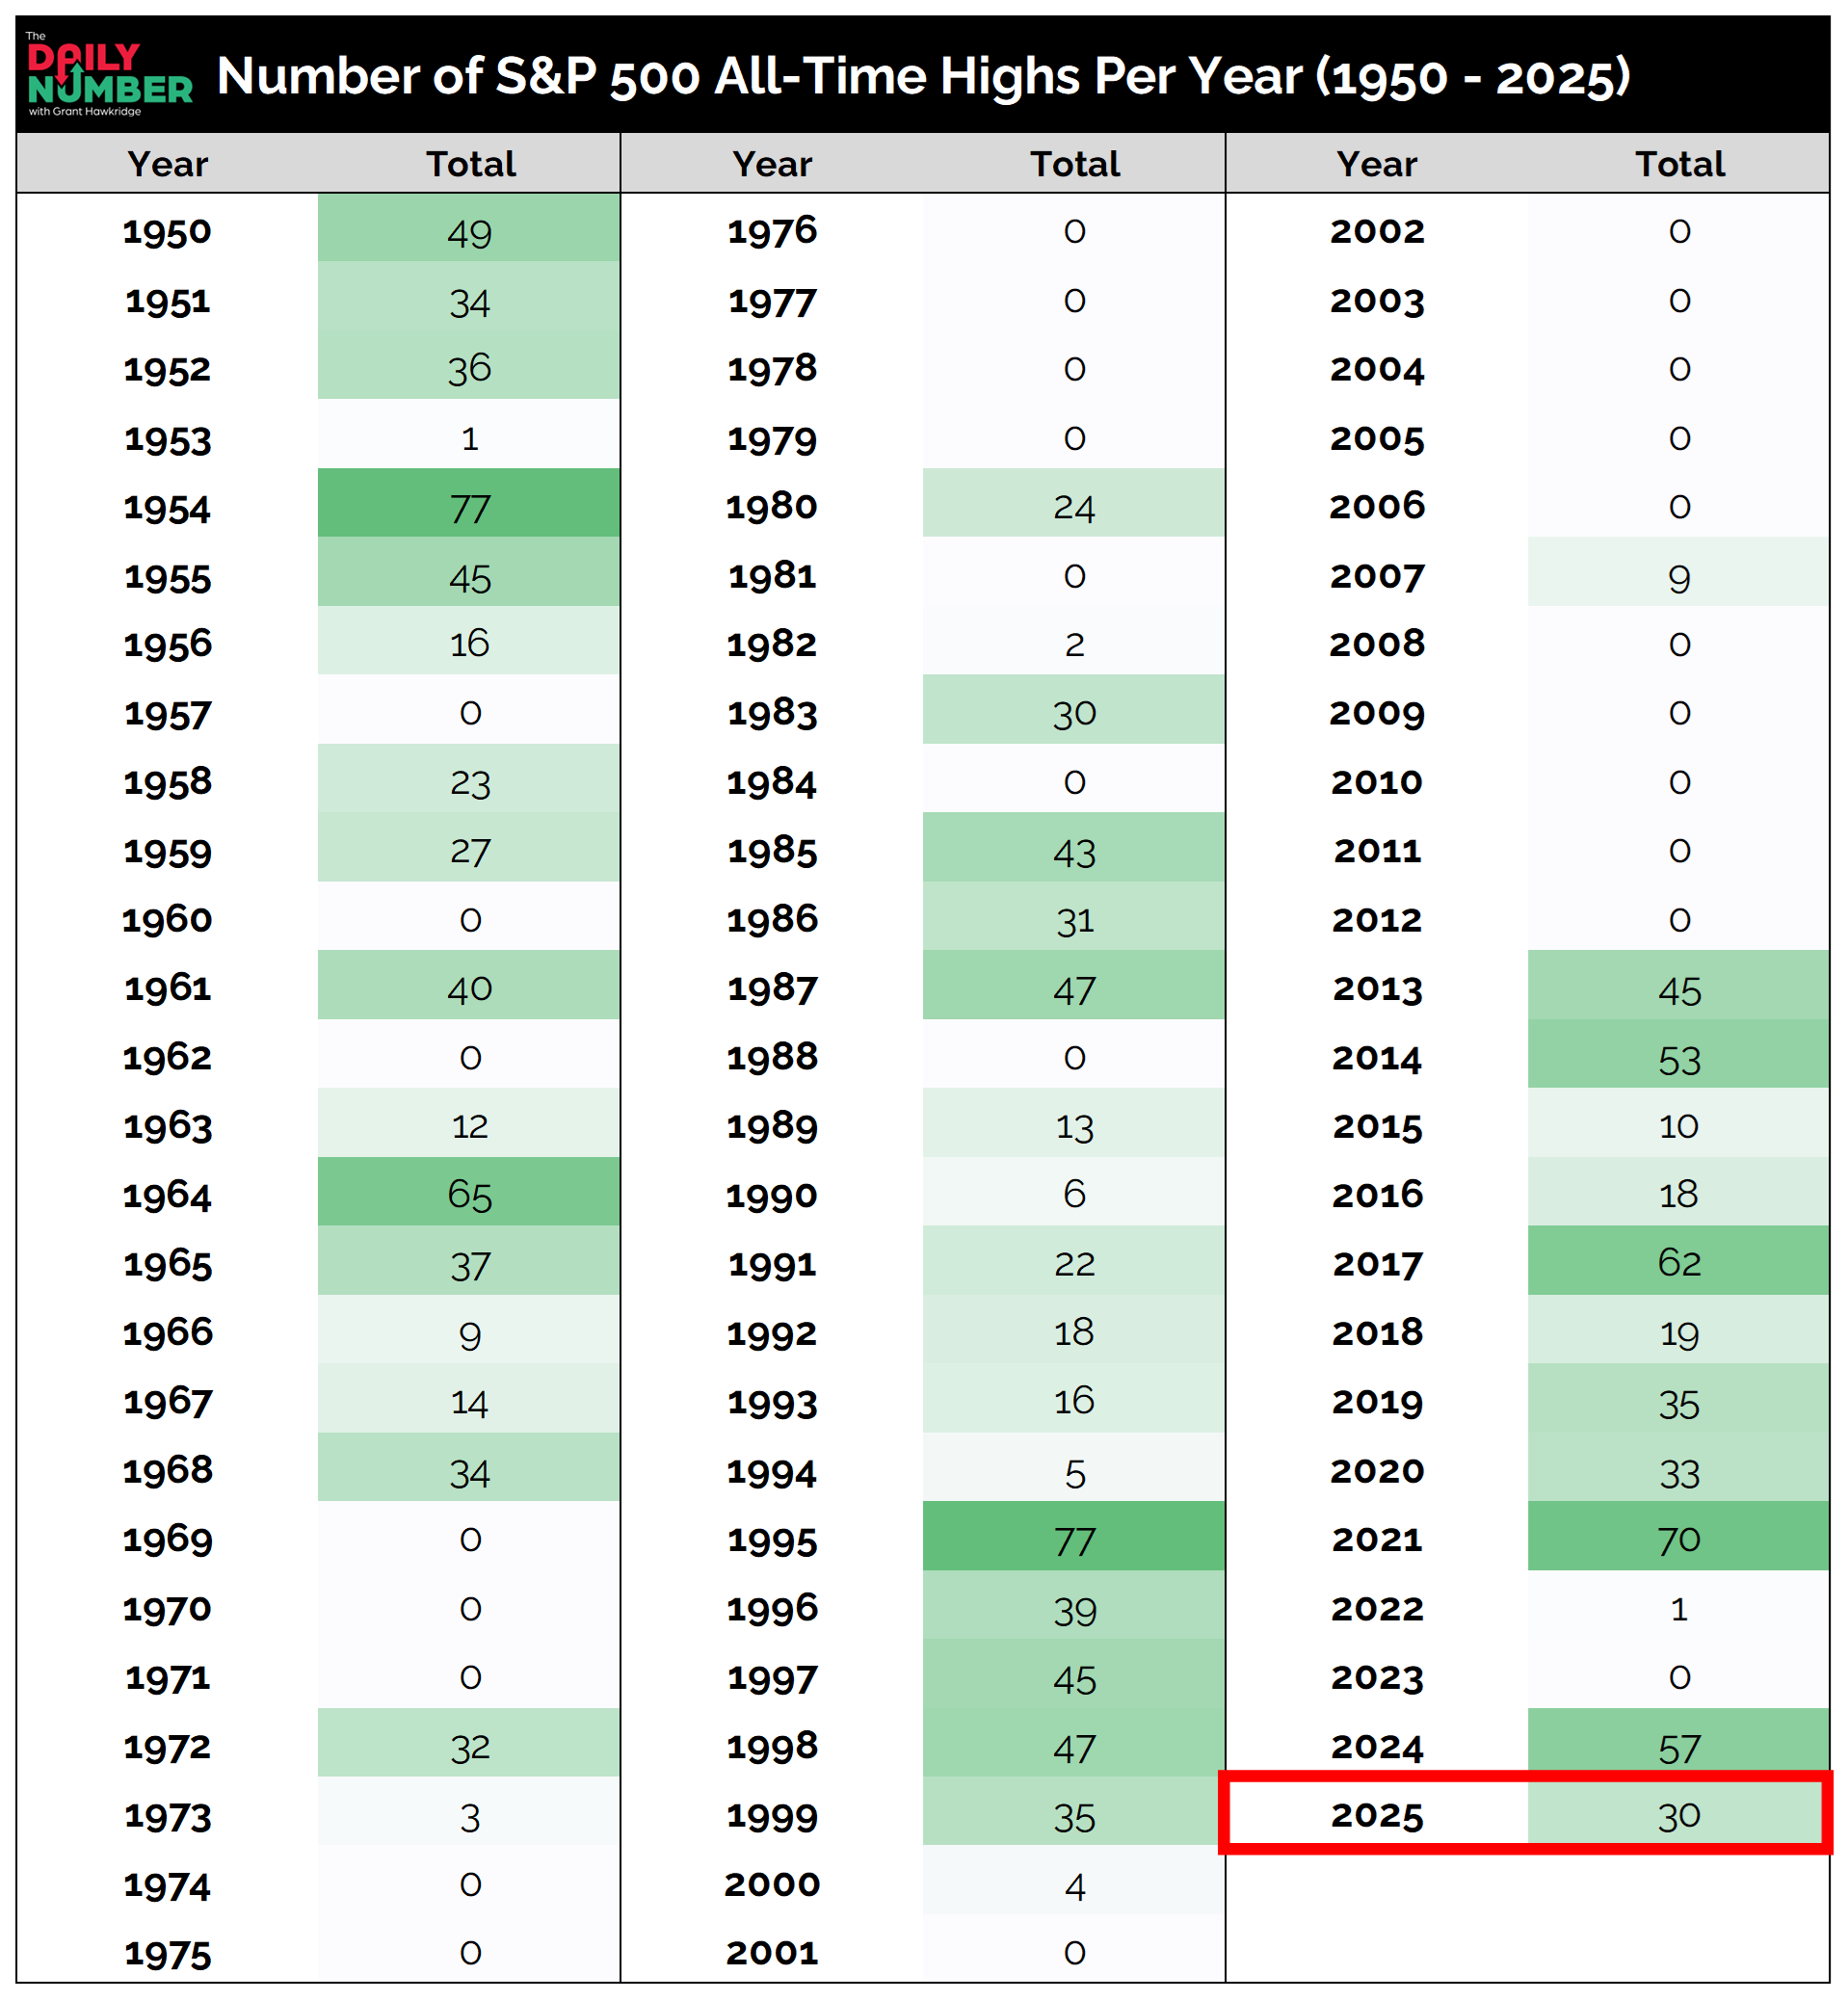
Let's break down what the table shows:
The table lists the number of all-time highs the S&P 500 posted in each calendar year from 1950 to 2025.
Dark green shading highlights years with high totals, while white indicates zero new highs.
The 2025 row is boxed in red, showing 30 all-time highs year-to-date.
The Takeaway: With three months still left in the year, 2025 has already delivered 30 record closes.
That puts it ahead of the long-term norm and firmly in the camp of strong bull market years.
History is clear: clusters of all-time highs don’t happen in weak or topping markets.
They show up when momentum is broad and trend persistence is strong. High counts tend to cluster in expansionary phases, when buyers are in control and uptrends are reinforced.
The percentage view tells the same story. So far, the S&P 500 has spent 15% of trading days at record levels in 2025. That’s not as extreme as 2021’s 27.8%, but it signals steady demand and participation.
This market isn’t just inching higher… It’s setting records at a healthy pace.
The real question is simple: how many more highs can this bull run rack up before the year is over?
Grant Hawkridge | Chief Aussie Operator, All Star Charts
If you’re interested in a full portfolio of small-cap trade ideas, take advantage of the special offer and sign up for All Star Charts premium risk-free today.
If you find my content valuable, I would greatly appreciate it if you could share it with your friends, family, and colleagues. Your help in spreading the word is invaluable in supporting our work. Thank you to all of you who share!