The S&P 500 has gone 31 consecutive trading days without moving more than 1% in either direction. That’s the longest stretch of calm since January 2020.
Here’s the chart:
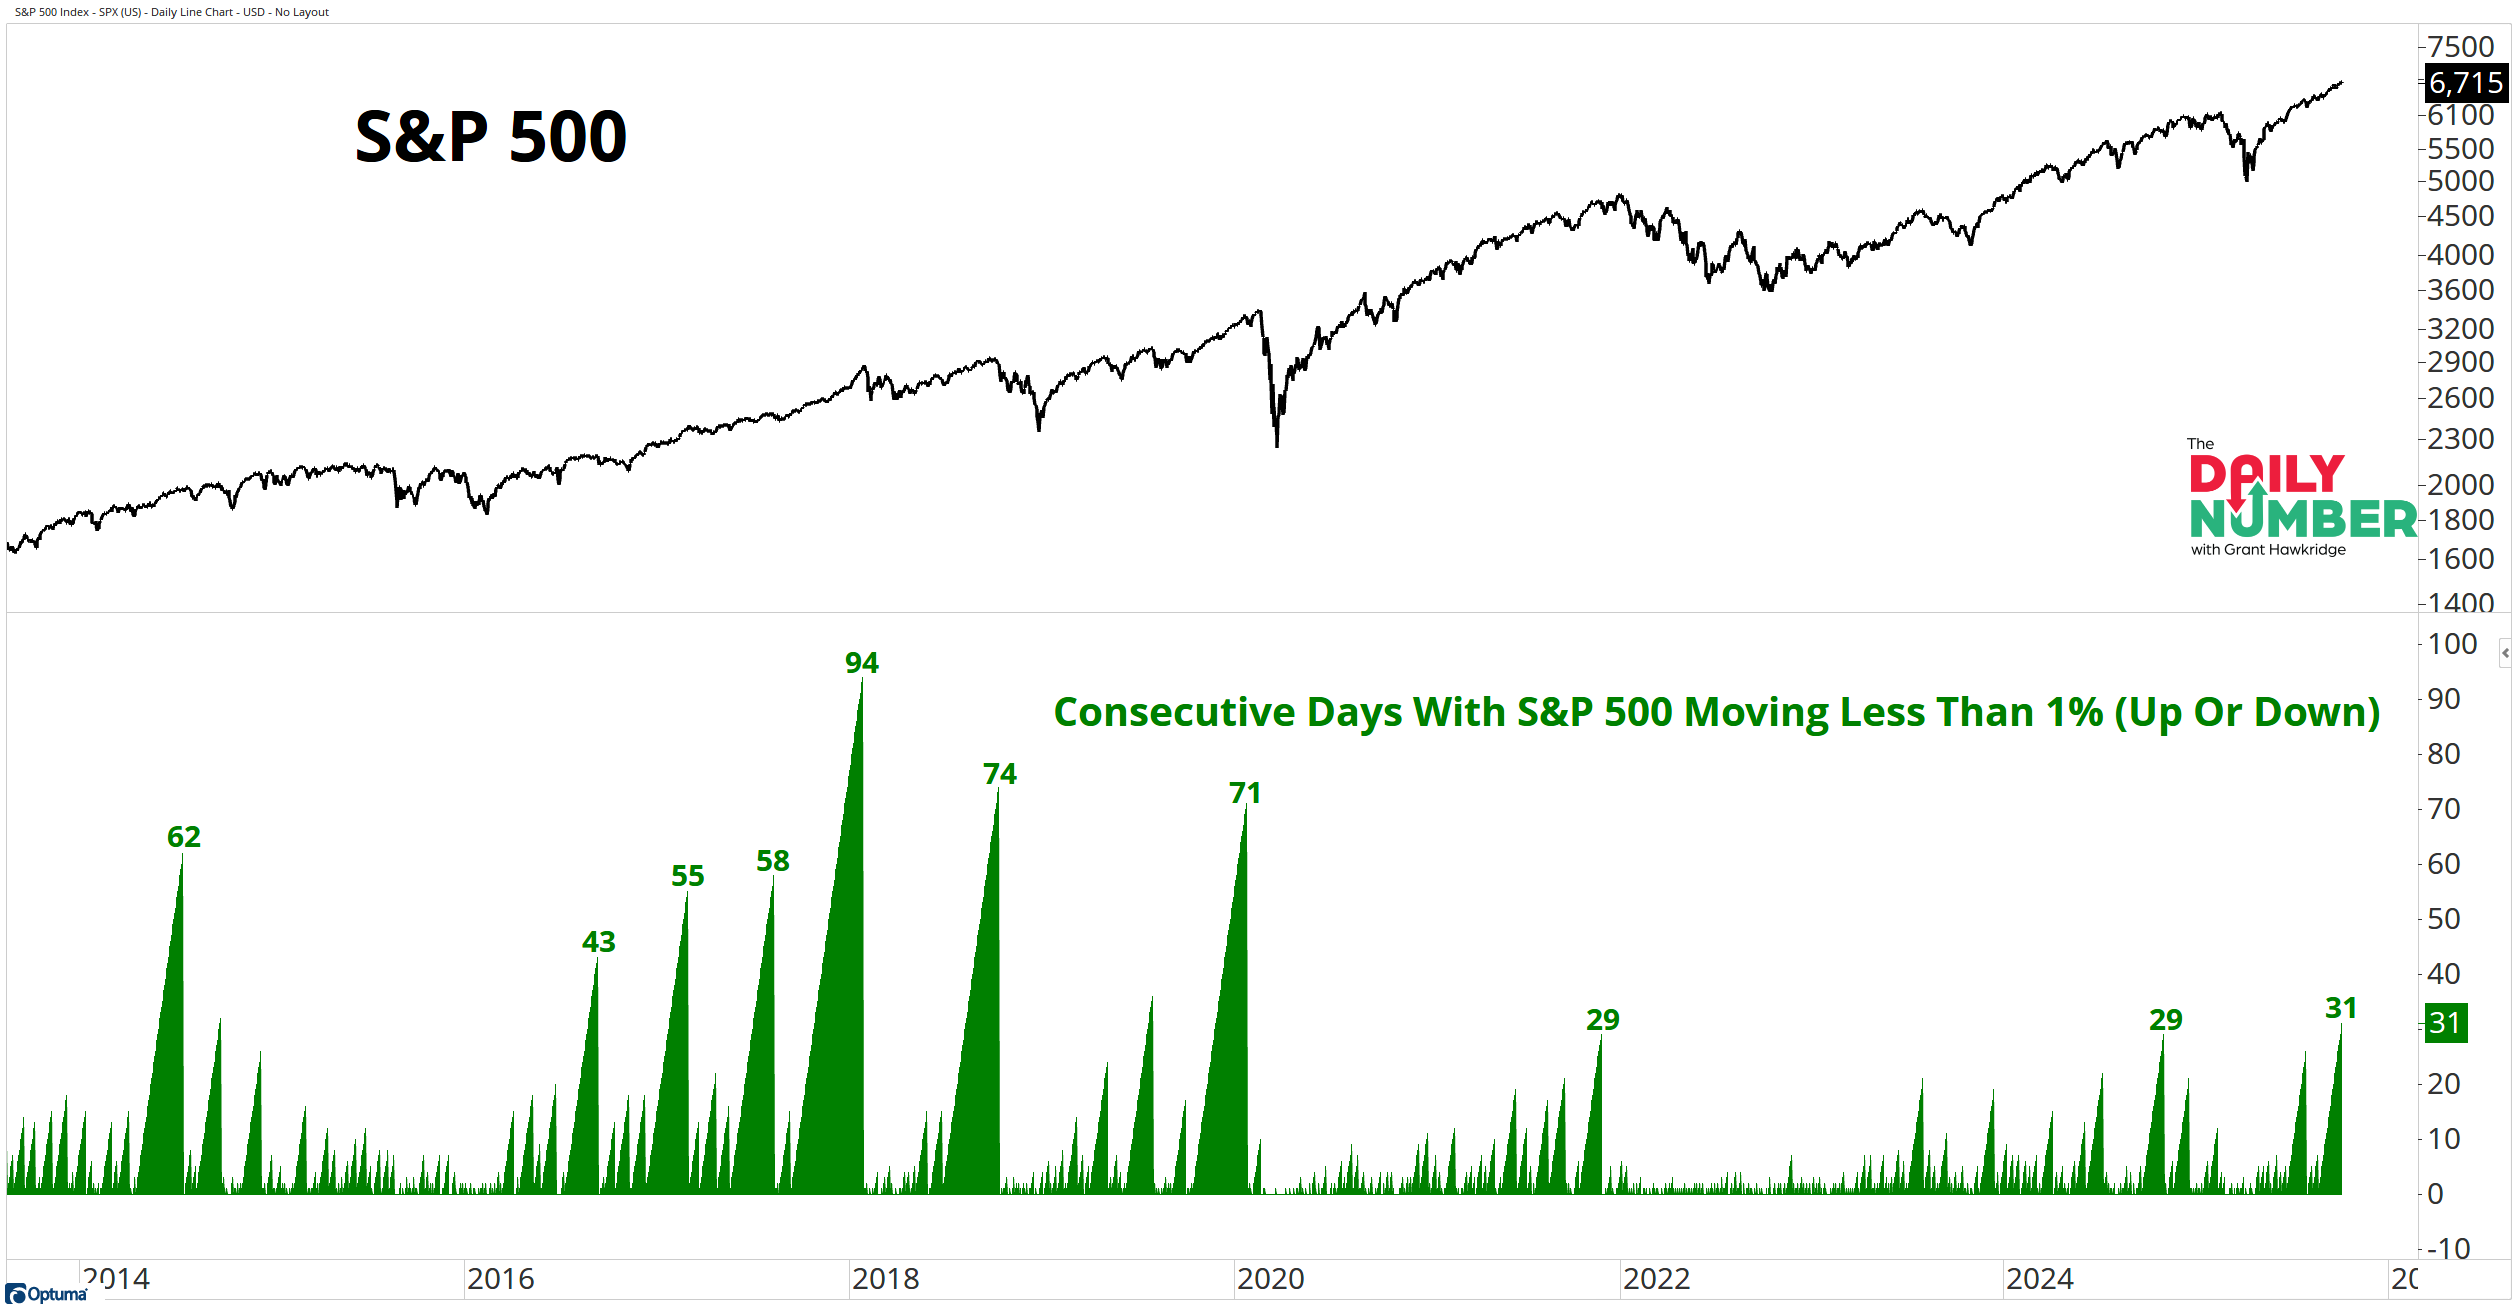
Let's break down what the chart shows:
The top panel plots the S&P 500 daily close in black.
The bottom panel tracks consecutive days in green when the index’s daily change stayed within ±1%.
The Takeaway: Quiet markets like this often show up during strong uptrends, not at their end.
The most notable example was in 2017, when the S&P 500 rose +19.4% while recording just eight ±1% days all year.
That was one of the smoothest advances in history, and it happened right in the heart of a strong uptrend.
By comparison, 2025 has already seen 43 ±1% days and is still up +14.2% year-to-date.
The market has earned this quiet stretch.
Price has trended higher, participation is broad, and investors aren’t flinching at every headline.
Low volatility isn’t a red flag. It’s a reflection of control.
When the tape tightens while price climbs, that usually signals strength, not fatigue.
The only question now: does this calm resolve in another leg higher, or is the next burst of volatility waiting just ahead?
If you find my content valuable, I would greatly appreciate it if you could share it with your friends, family, and colleagues. Your help in spreading the word is invaluable in supporting our work. Thank you to all of you who share!