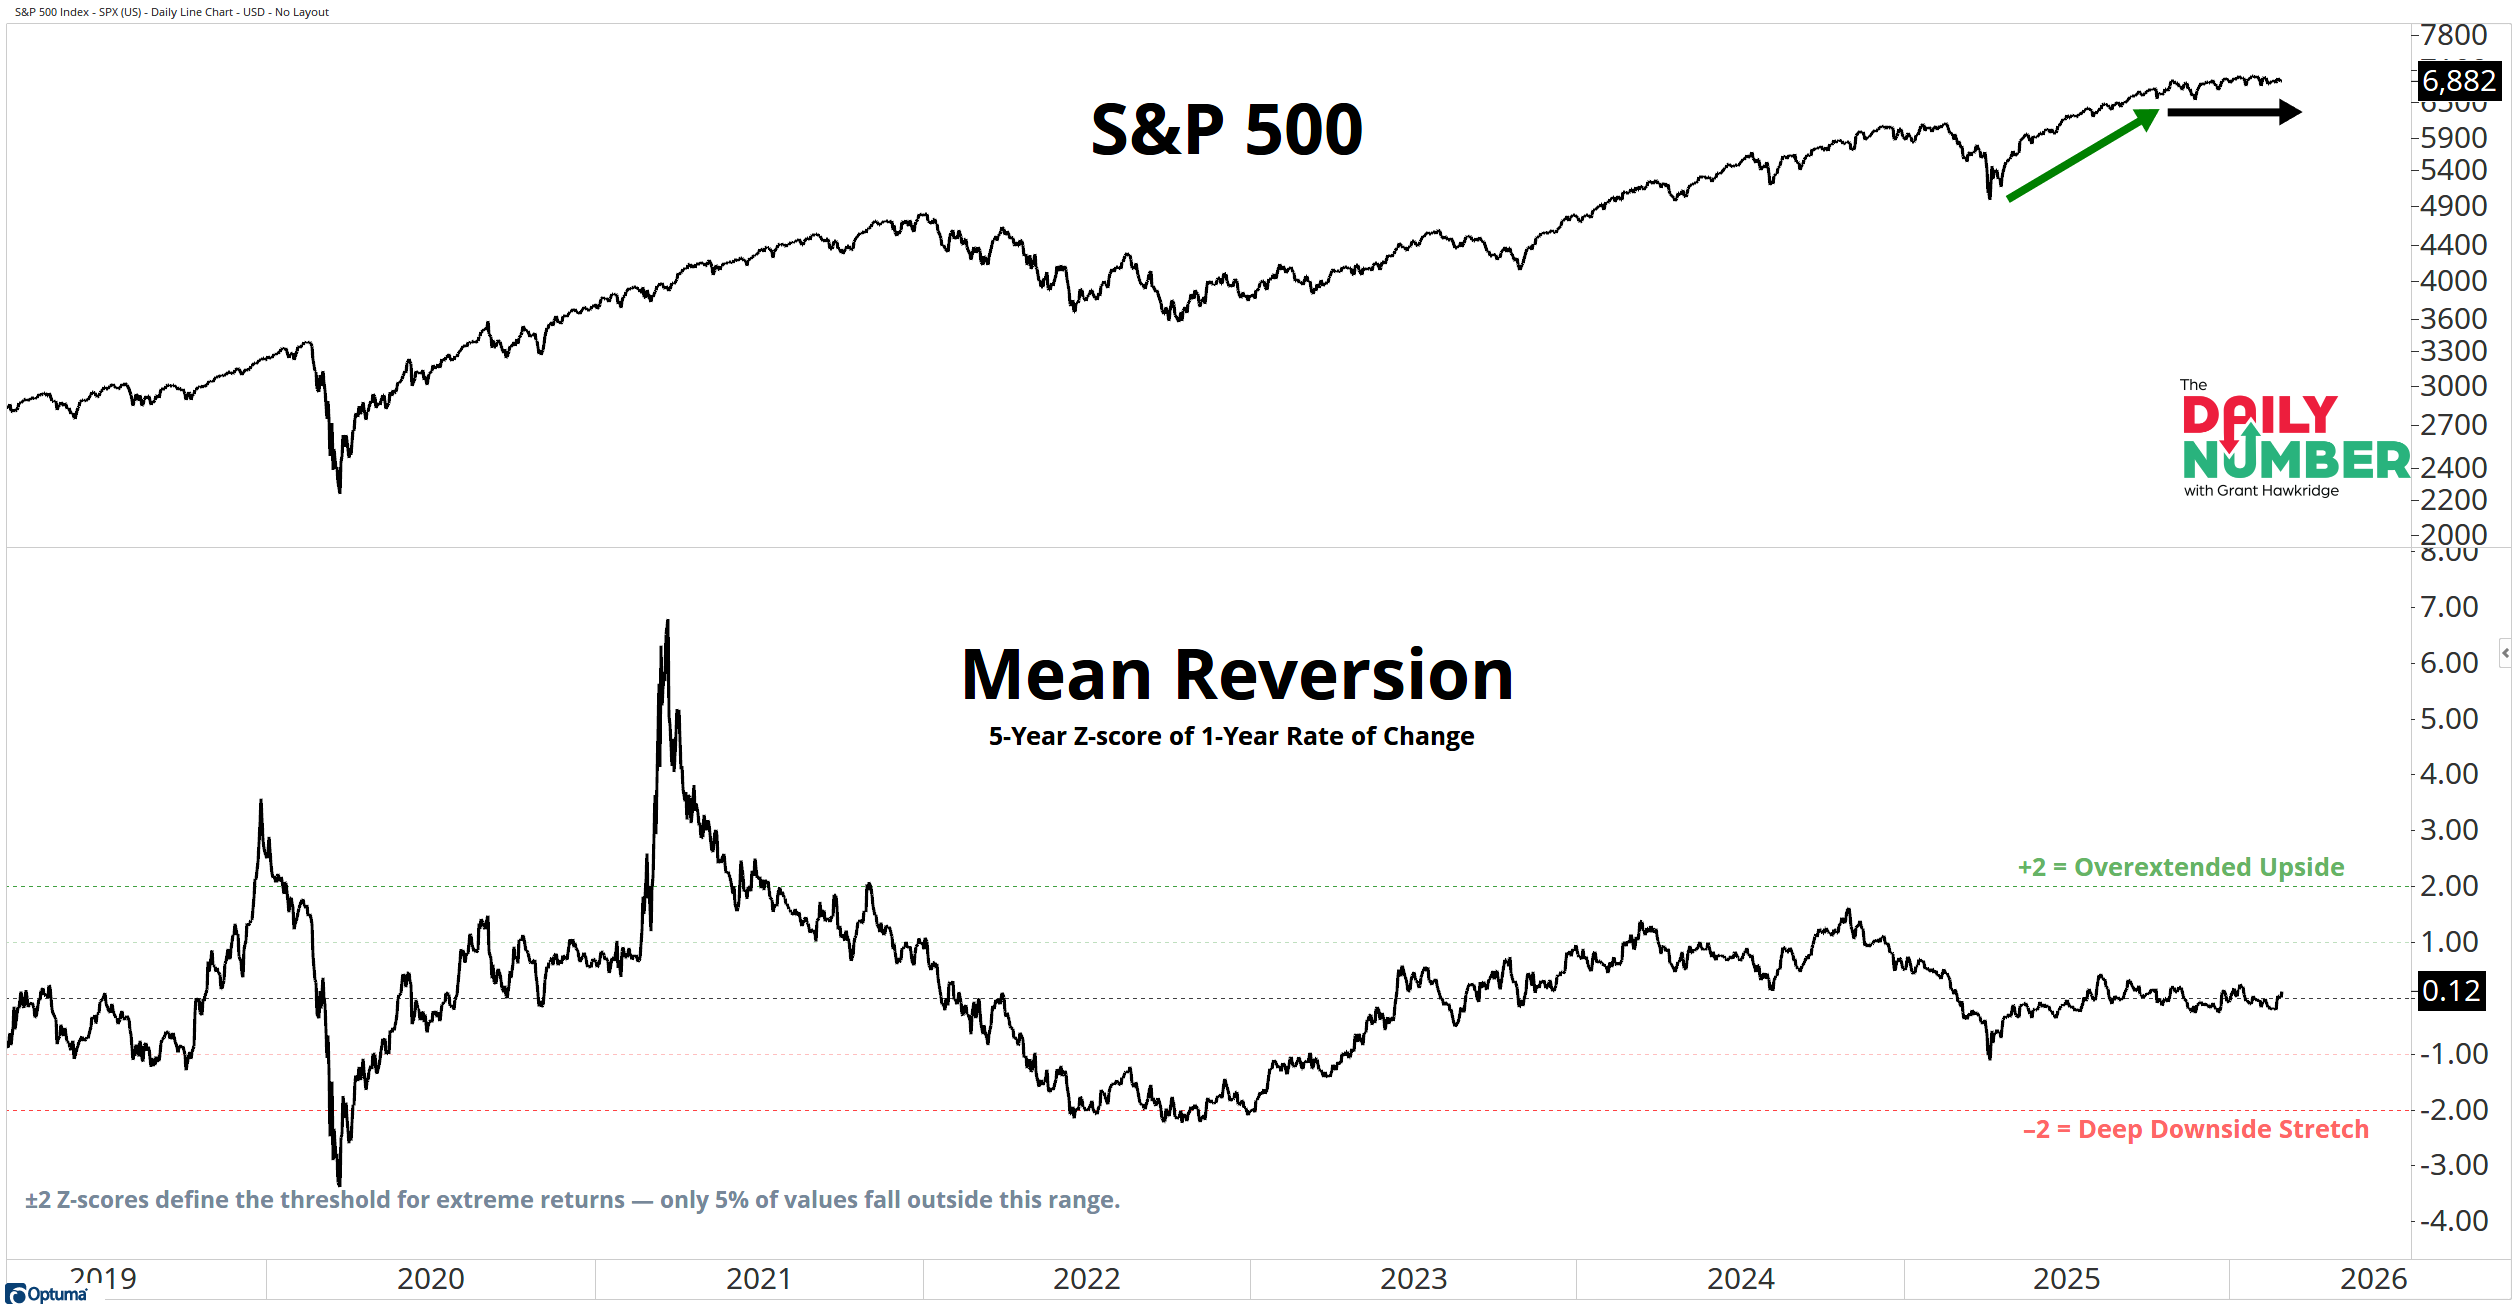
The S&P 500’s 5-year Z-score of its 1-year rate of change sits at 0.12.
Here’s the chart:
Let's break down what the chart shows:
The top panel displays the S&P 500 price in black.
The lower panel displays the 5-Year Z-Score of the 1-Year Rate of Change in black.
Horizontal reference lines are plotted at +2, +1, 0, -1, and -2.
The Takeaway: This indicator measures how stretched the S&P 500’s 12-month return is versus its own five-year history. Zero is normal. +2 or -2 is extreme. I track it to know when momentum is extended and when it resets.
0.12 is neutral. The 12-month return is in line with its long-term average. The acceleration phase off the April lows has cooled.
The momentum expansion phase off that low drove the surge in returns. That phase is done. Price has now spent four months moving sideways near the highs. The reset is happening through time, not price.
This rally never overheated, and it has not shifted into downside pressure during this recent consolidation. There was no blow-off. There is no breakdown.
There is no stretch to unwind or no panic to reverse. The market is sitting at equilibrium near the highs.
If price breaks higher, the Z-score should expand with it. If the Z-score turns lower while price stays flat, that is the early warning.
Momentum is neutral and price is tight at the highs. The next move will show up in expansion. Does it come to the upside or the downside?