The S&P 500 has gone 68 trading days without a 5% pullback.
Here’s the chart:
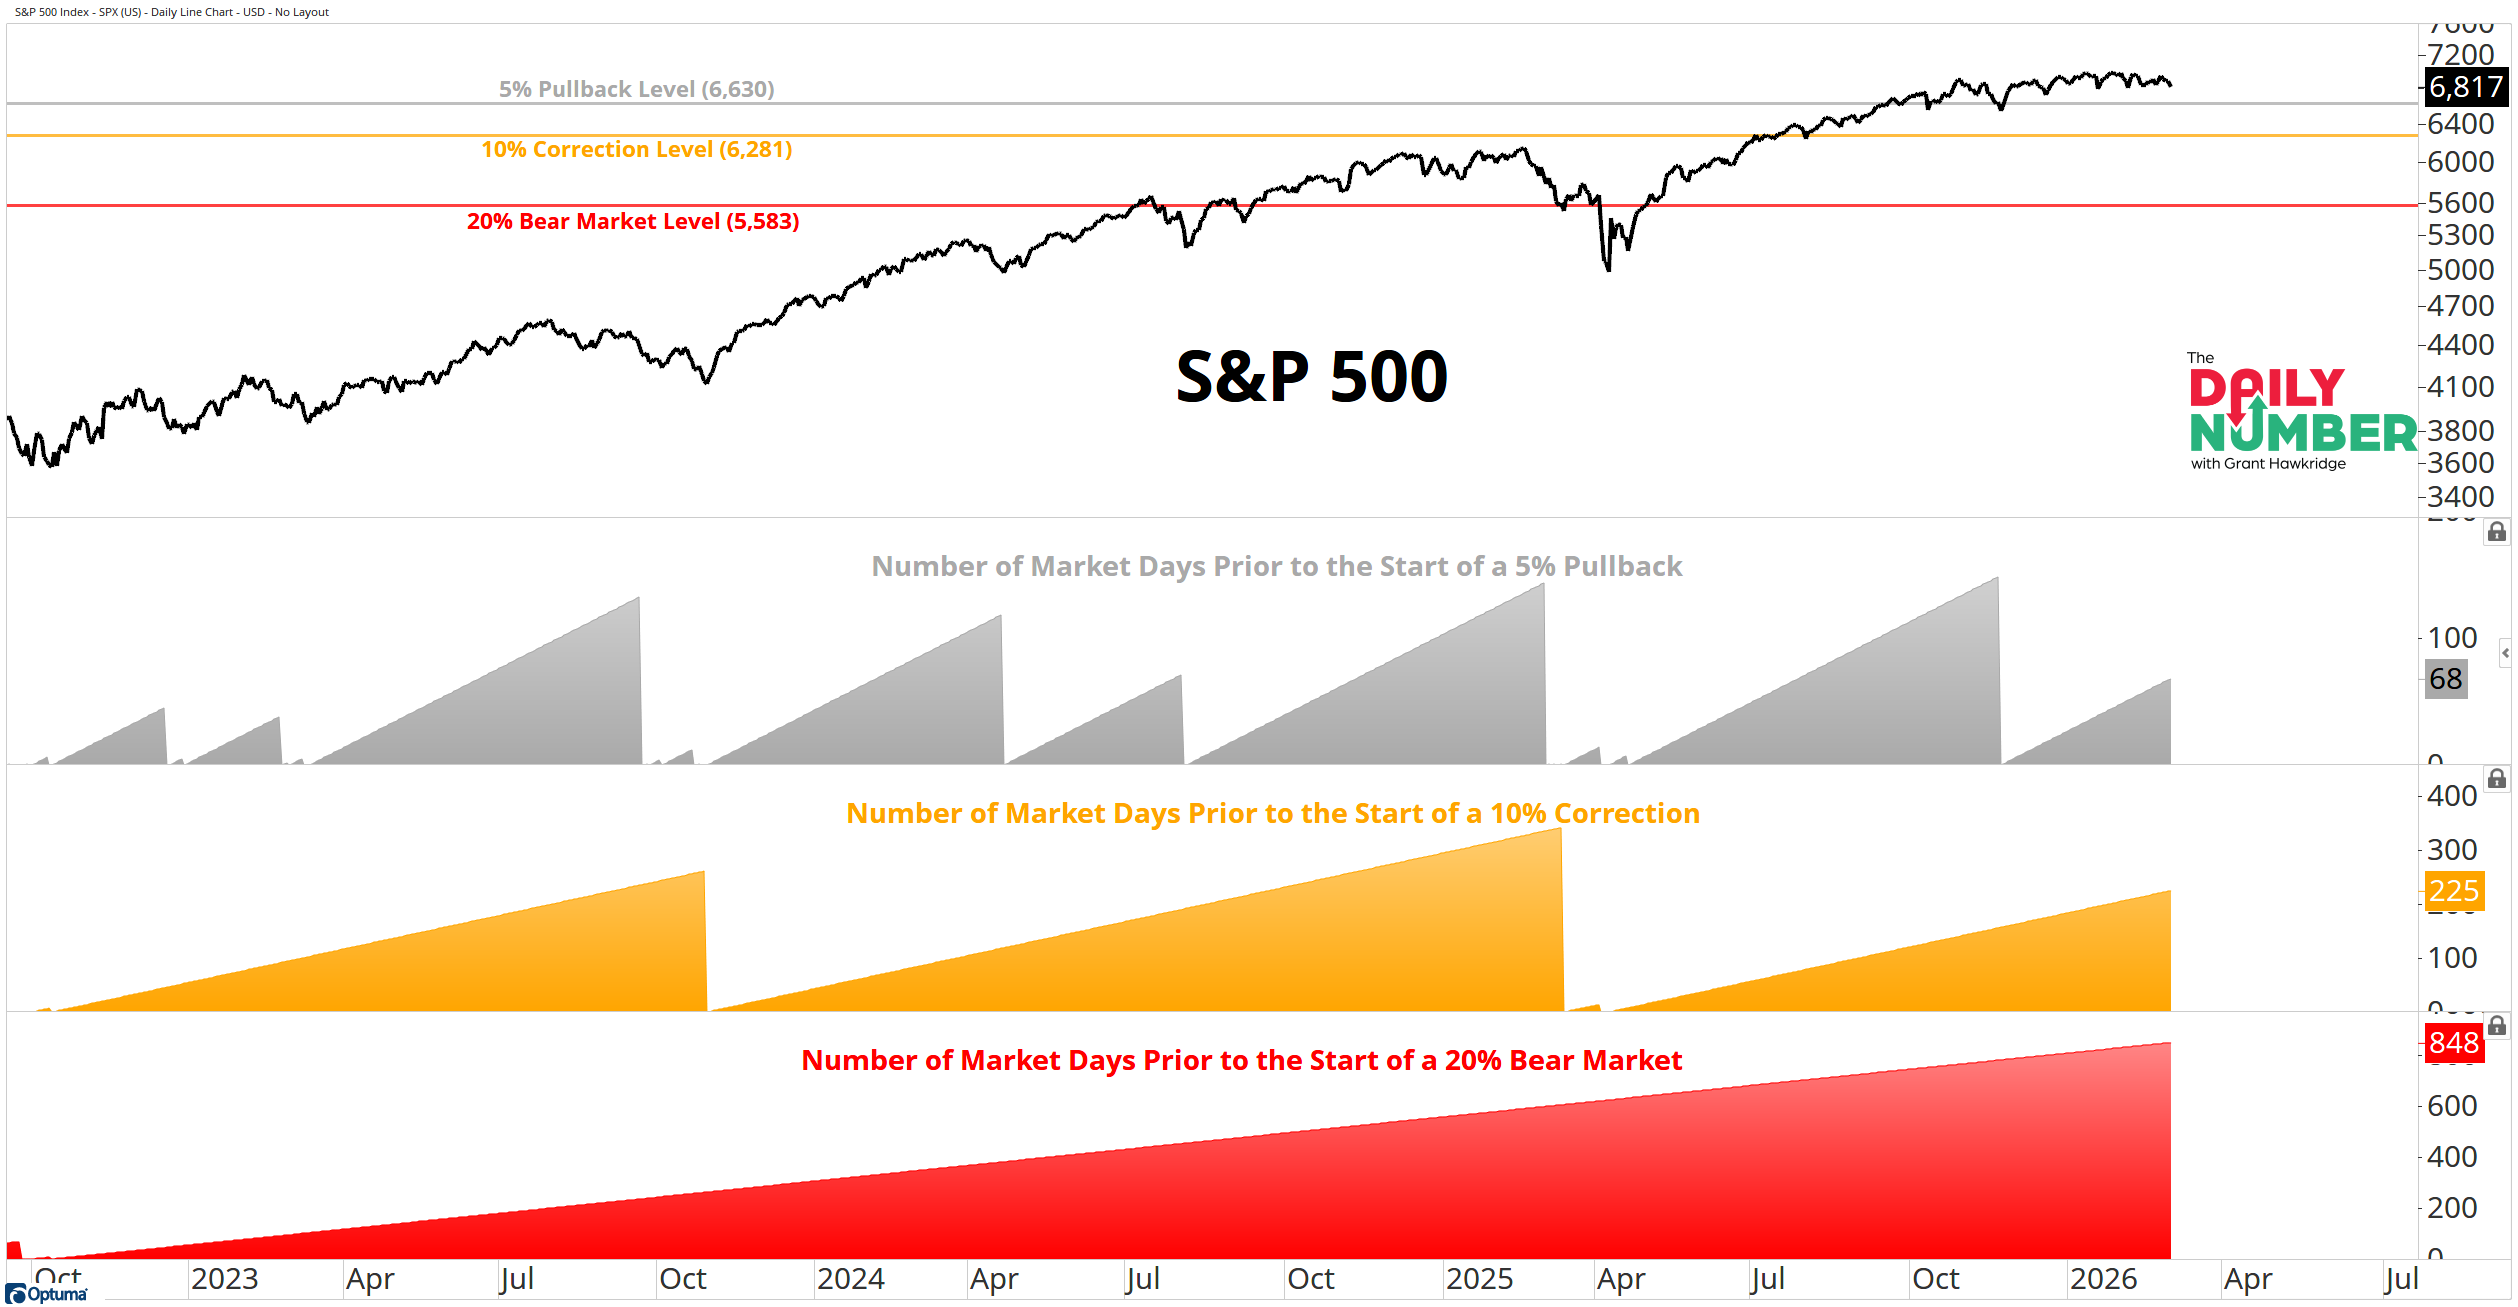
Let's break down what the chart shows:
The top section displays the S&P 500 price in black.
Three horizontal lines appear across the chart. A grey line marks the 5% pullback level. An orange line marks the 10% correction level. A red line marks the 20% bear market level.
The middle section displays the number of market days prior to the start of a 5% pullback in grey.
The next section displays the number of market days prior to the start of a 10% correction in orange.
The bottom section displays the number of market days prior to the start of a 20% bear market in red.
The Takeaway: The S&P 500 peaked at 6,979 on January 27th. Price now sits at 6,817. The index is only 2.3% below that high.
The first real pullback level sits at 6,630. That marks a 5% decline from the peak.
The market has gone 68 trading days without a 5% pullback. Price has spent the last two months grinding sideways near its highs instead.
Since 1950, the S&P 500 has averaged about three 5% pullbacks per year. We normally see one roughly every four months. We have not seen one yet this year.
A move down to 6,630 would not change the trend. It would simply mark the first routine reset of the year.
Bull markets often behave like this. Price holds near the highs while time does the resetting. The first real pullback level still sits below at 6,630.
The streak now sits at 68 trading days without a 5% dip.
How much longer before the market finally tags 6,630?