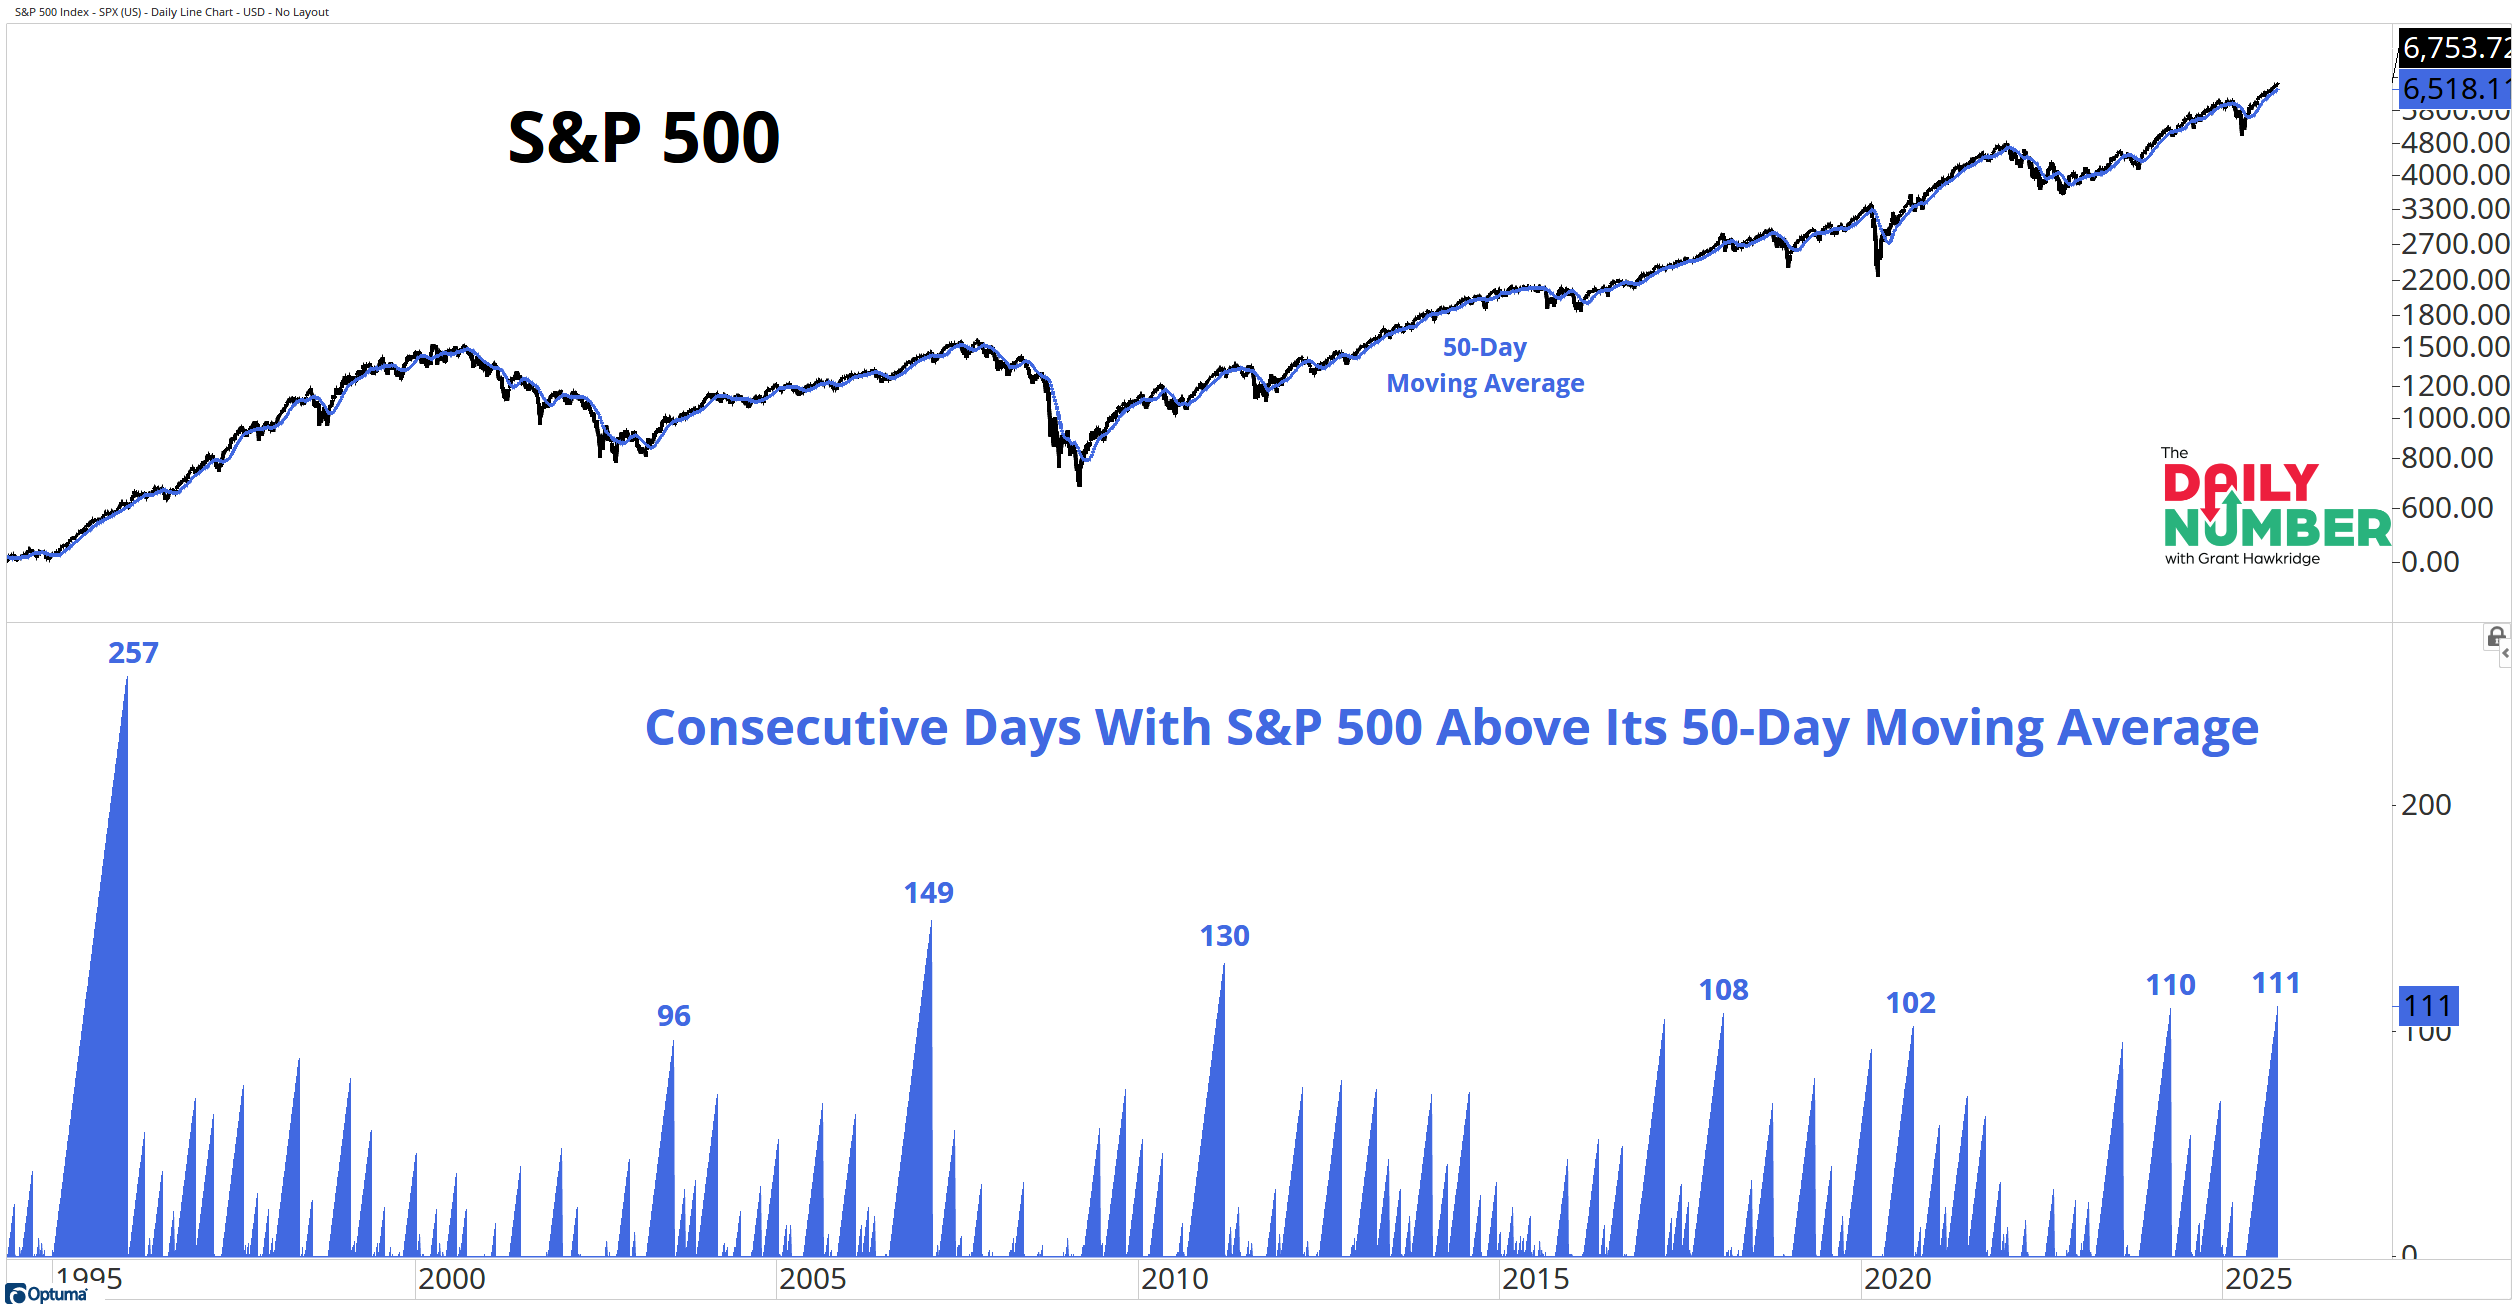
The S&P 500 has now closed above its 50-day moving average for 111 straight trading days, the longest streak since 2011.
Here’s the chart:
Let's break down what the chart shows:
The top panel shows the S&P 500 daily close in black, with its 50-day moving average in blue.
The bottom panel tracks the number of consecutive sessions the index has stayed above that moving average. Each blue spike represents a period of persistent strength, during which the price held above its short-term moving average.
The Takeaway: This is the longest stretch of sustained trend strength in more than a decade.
It highlights how steady this bull market has been, even through pullbacks, rotation, and headline noise.
Every dip has been met with demand.
When an index stays above its 50-day moving average for this long, it means sellers have lost control and buyers keep stepping in before momentum can fade.
That’s when trend followers stay long, volatility stays calm, and the path of least resistance stays higher.
These streaks rarely appear at market tops. They tend to show up in the middle stages of strong bull markets, when breadth, leadership, and price momentum are all aligned.
If strength really does breed strength, this market is still running with the wind at its back.
If you find my content valuable, I would greatly appreciate it if you could share it with your friends, family, and colleagues. Your help in spreading the word is invaluable in supporting our work. Thank you to all of you who share!