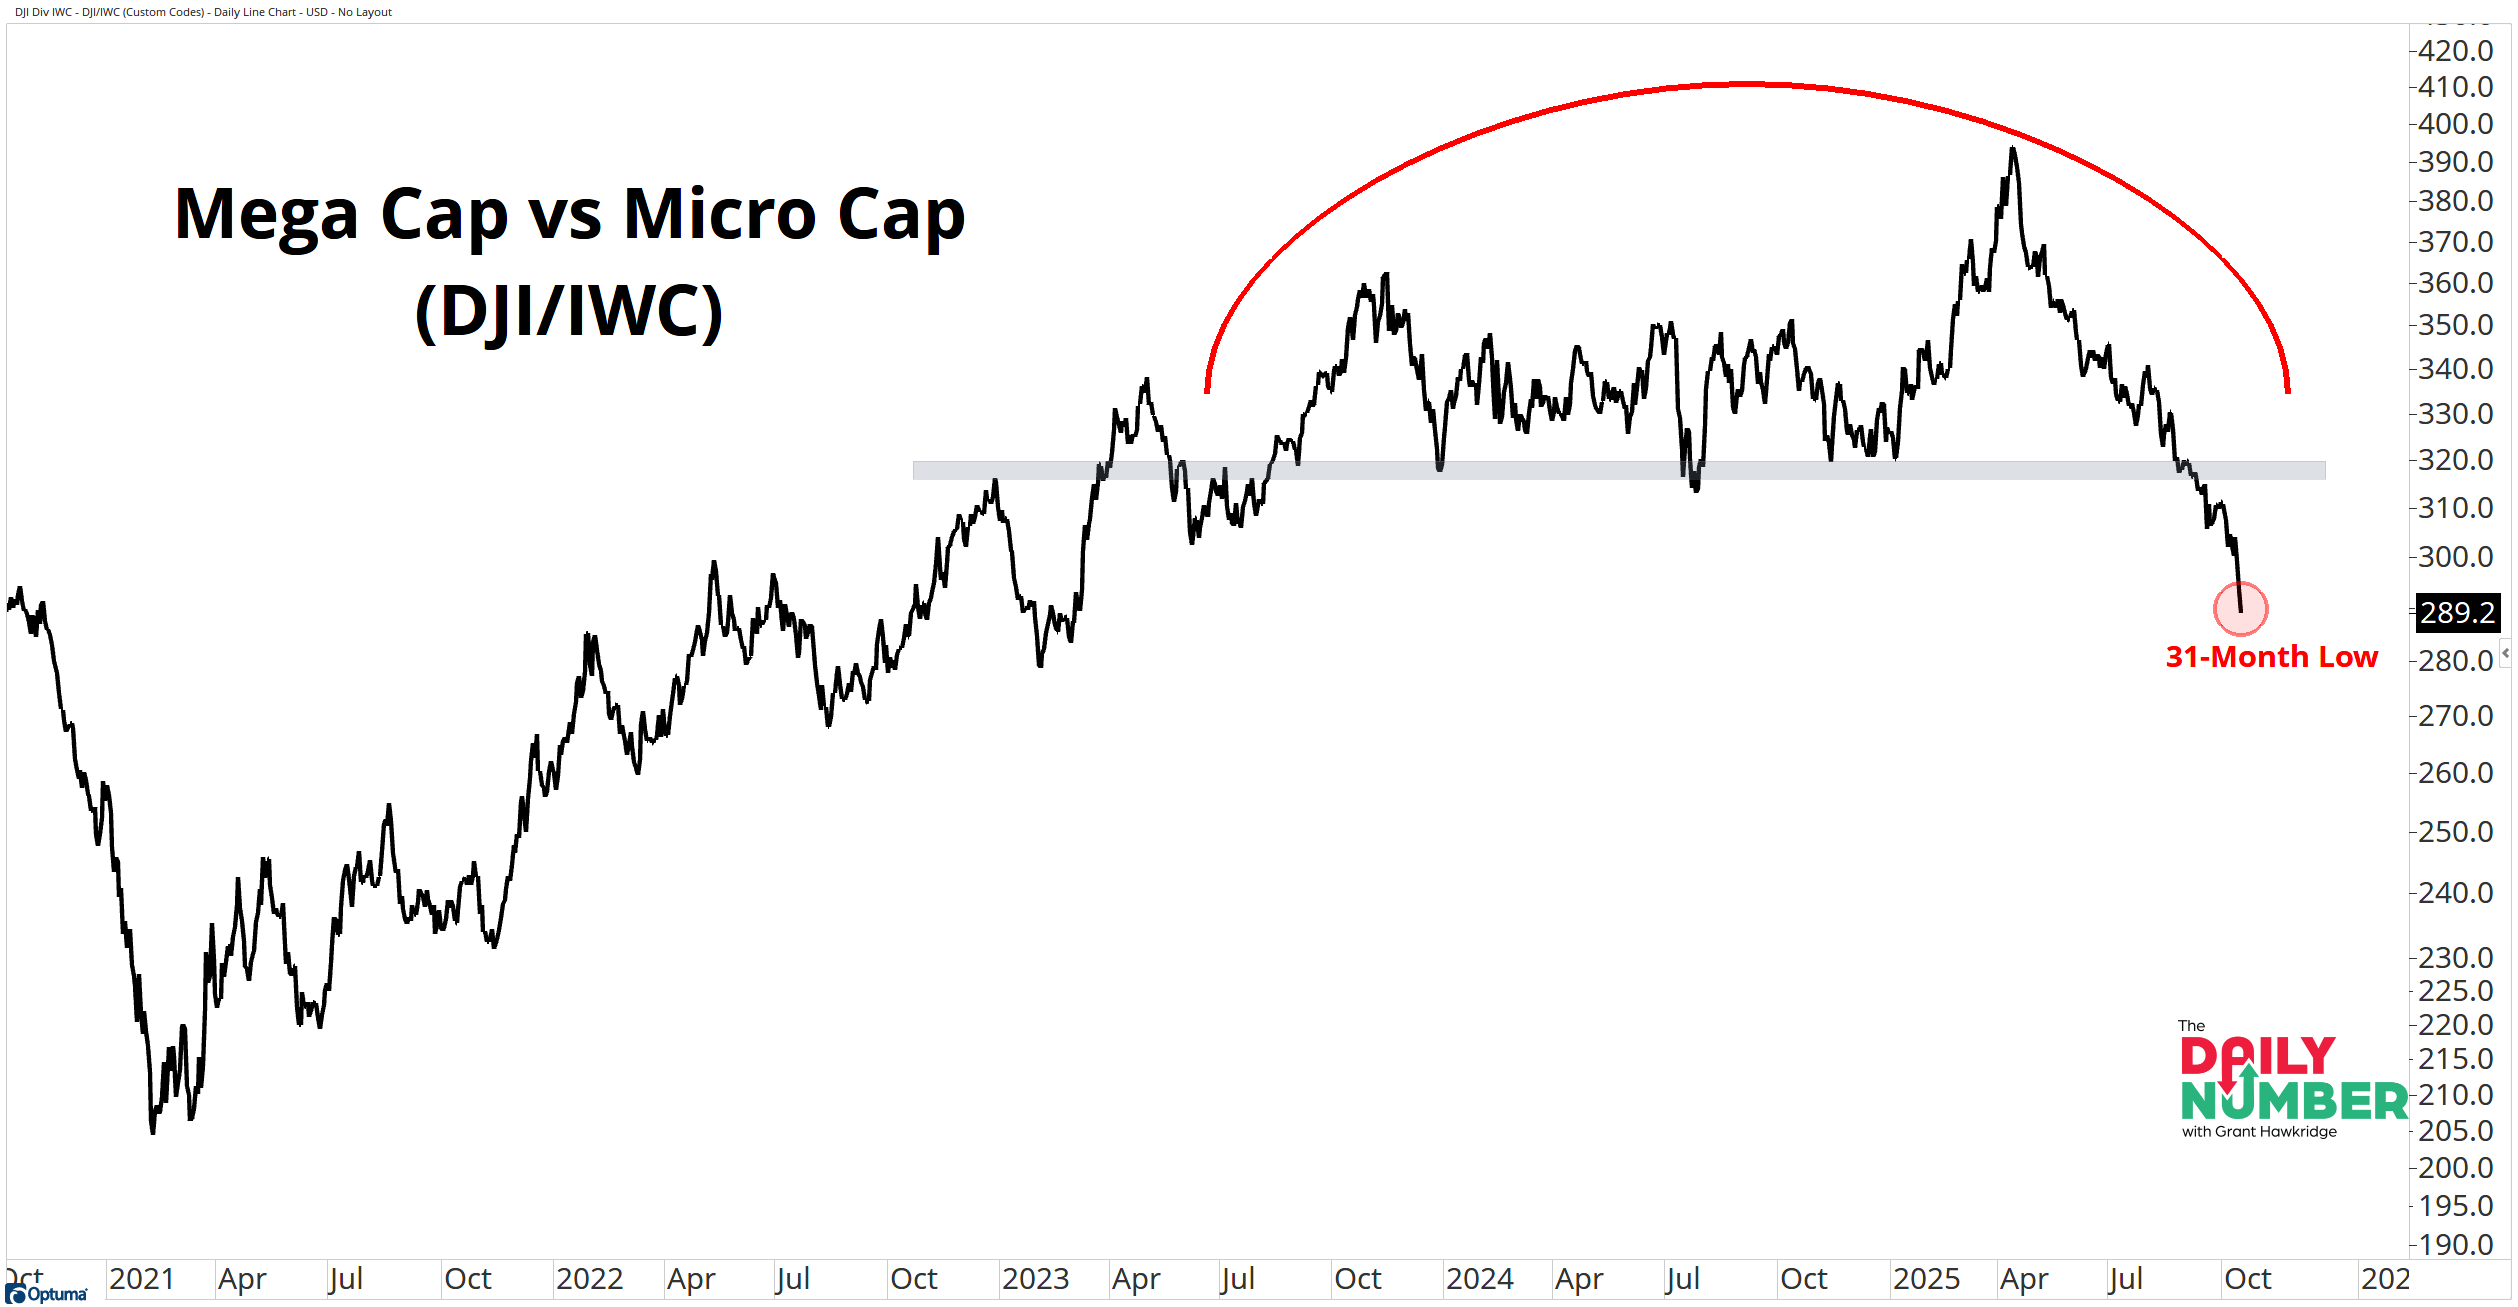
The Mega Cap vs Micro Cap ratio (DJI/IWC) just hit a 31-month low, its weakest level since early 2023.
Here’s the chart:
Let's break down what the chart shows:
This is the relative ratio of the Dow Jones Industrial Average (DJI) vs. the Micro-Cap ETF (IWC). When the line rises, mega-cap stocks are outperforming. When the line falls, micro-caps are leading.
The Takeaway: Since February 2021, mega caps have steadily outperformed micro caps.
That four-year run defined this bull market’s leadership.
But the structure is changing. The ratio is completing a multi-year top and has broken through major support.
Smaller, higher-beta stocks are starting to outperform, showing a rotation toward higher risk appetite. When that happens, markets often move from concentration to participation, which is a sign of internal strength, not weakness.
This is the opposite of late-stage narrowness.
That message is reinforced by price. Micro caps just closed at an all-time high yesterday, confirming strength on both an absolute and relative basis.
If this ratio keeps sliding, it confirms that capital is rotating down the size curve. If it recovers above the breakdown level, the old mega-cap regime might not be done yet.
A pause in mega caps, or the birth of new leadership?
If you find my content valuable, I would greatly appreciate it if you could share it with your friends, family, and colleagues. Your help in spreading the word is invaluable in supporting our work. Thank you to all of you who share!