Gold has stayed above its 200-day moving average for 518 straight trading days. That’s the 4th-longest streak since 1968.
Here’s the chart:
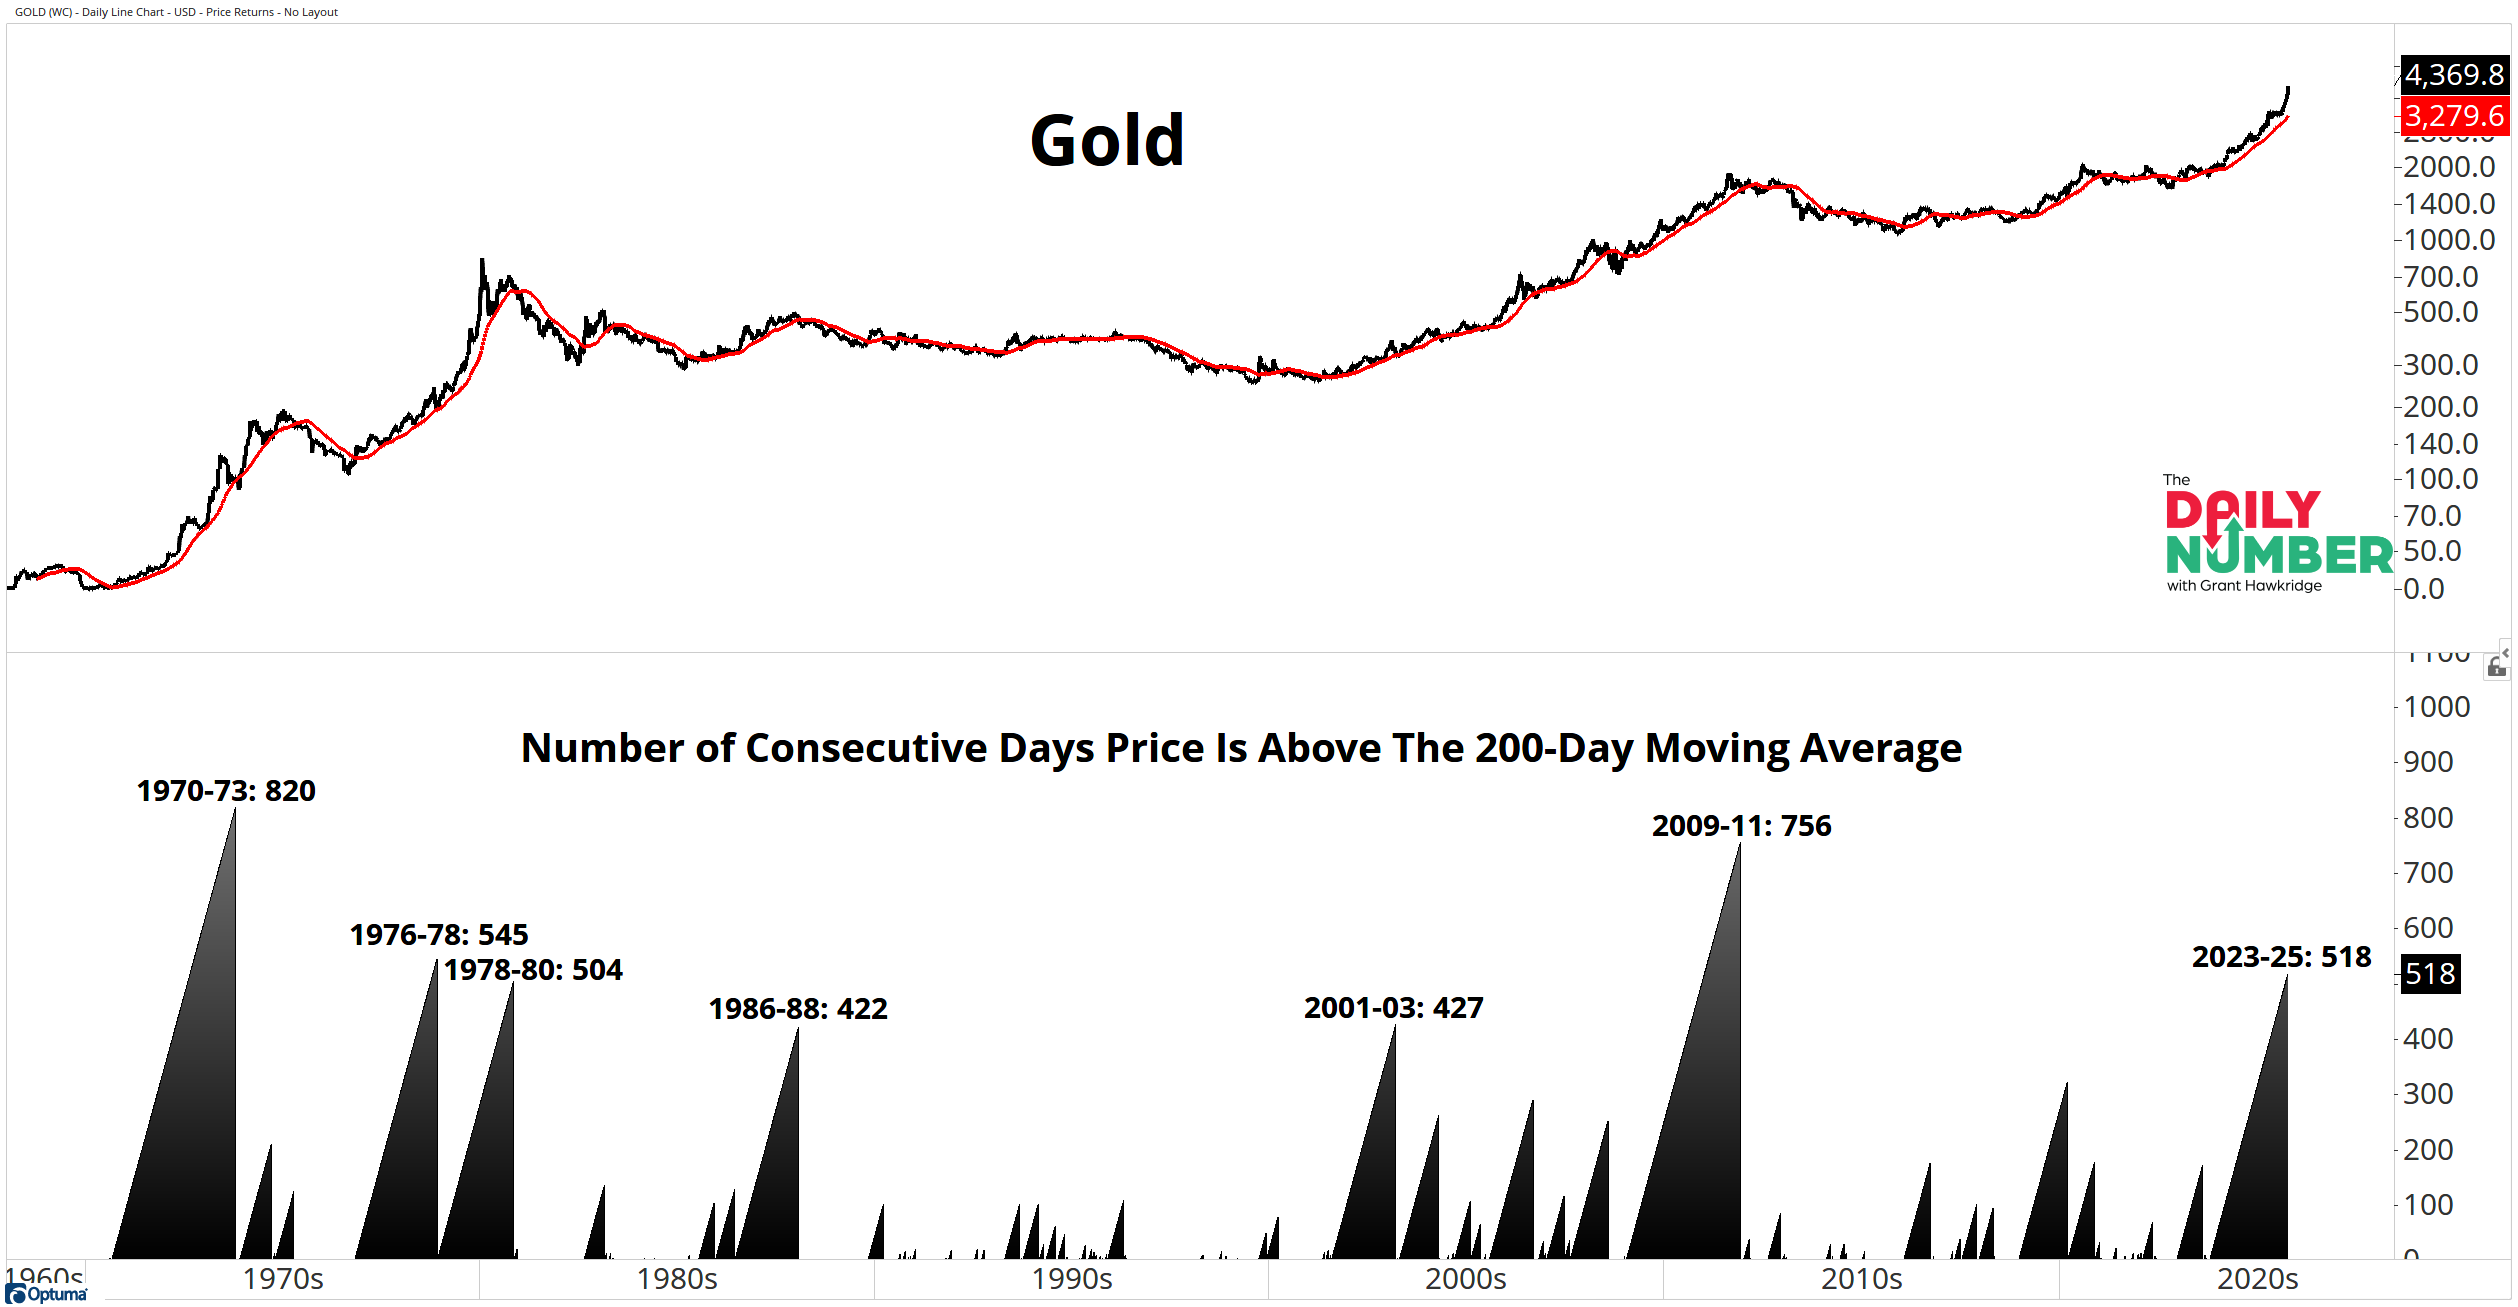
Let's break down what the chart shows:
The top panel plots the daily price of gold in black with the 200-day moving average in red.
The bottom panel tracks the length of those streaks over time in black, showing how the current run stacks up against past cycles.
The Takeaway: Gold is trading at all-time highs and looks set to close its ninth straight week of gains.
It has now stayed above its 200-day average for more than two years and currently sits 33% above that trend line, the widest spread since 2006.
Only three streaks have lasted longer: 1970-73, 1976-78, and 2009-11.
A run this long and this extended above trend reflects powerful underlying demand and clear risk appetite for the shiny metal.
But when moves stretch this far, some short-term consolidation becomes more likely. That’s part of how strong trends reset before moving again.
Gold’s trend is mature but still dominant. As long as price holds above that red line, the path of least resistance remains higher. If the streak keeps climbing, we may be watching one of the defining gold bull markets of the modern era.
How long can it keep shining before gravity takes hold?
If you find my content valuable, I would greatly appreciate it if you could share it with your friends, family, and colleagues. Your help in spreading the word is invaluable in supporting our work. Thank you to all of you who share!