Five trading days remain for the Zweig Breadth Thrust to reach its 0.615 trigger level.
Here’s the chart:
Let's break down what the chart shows:
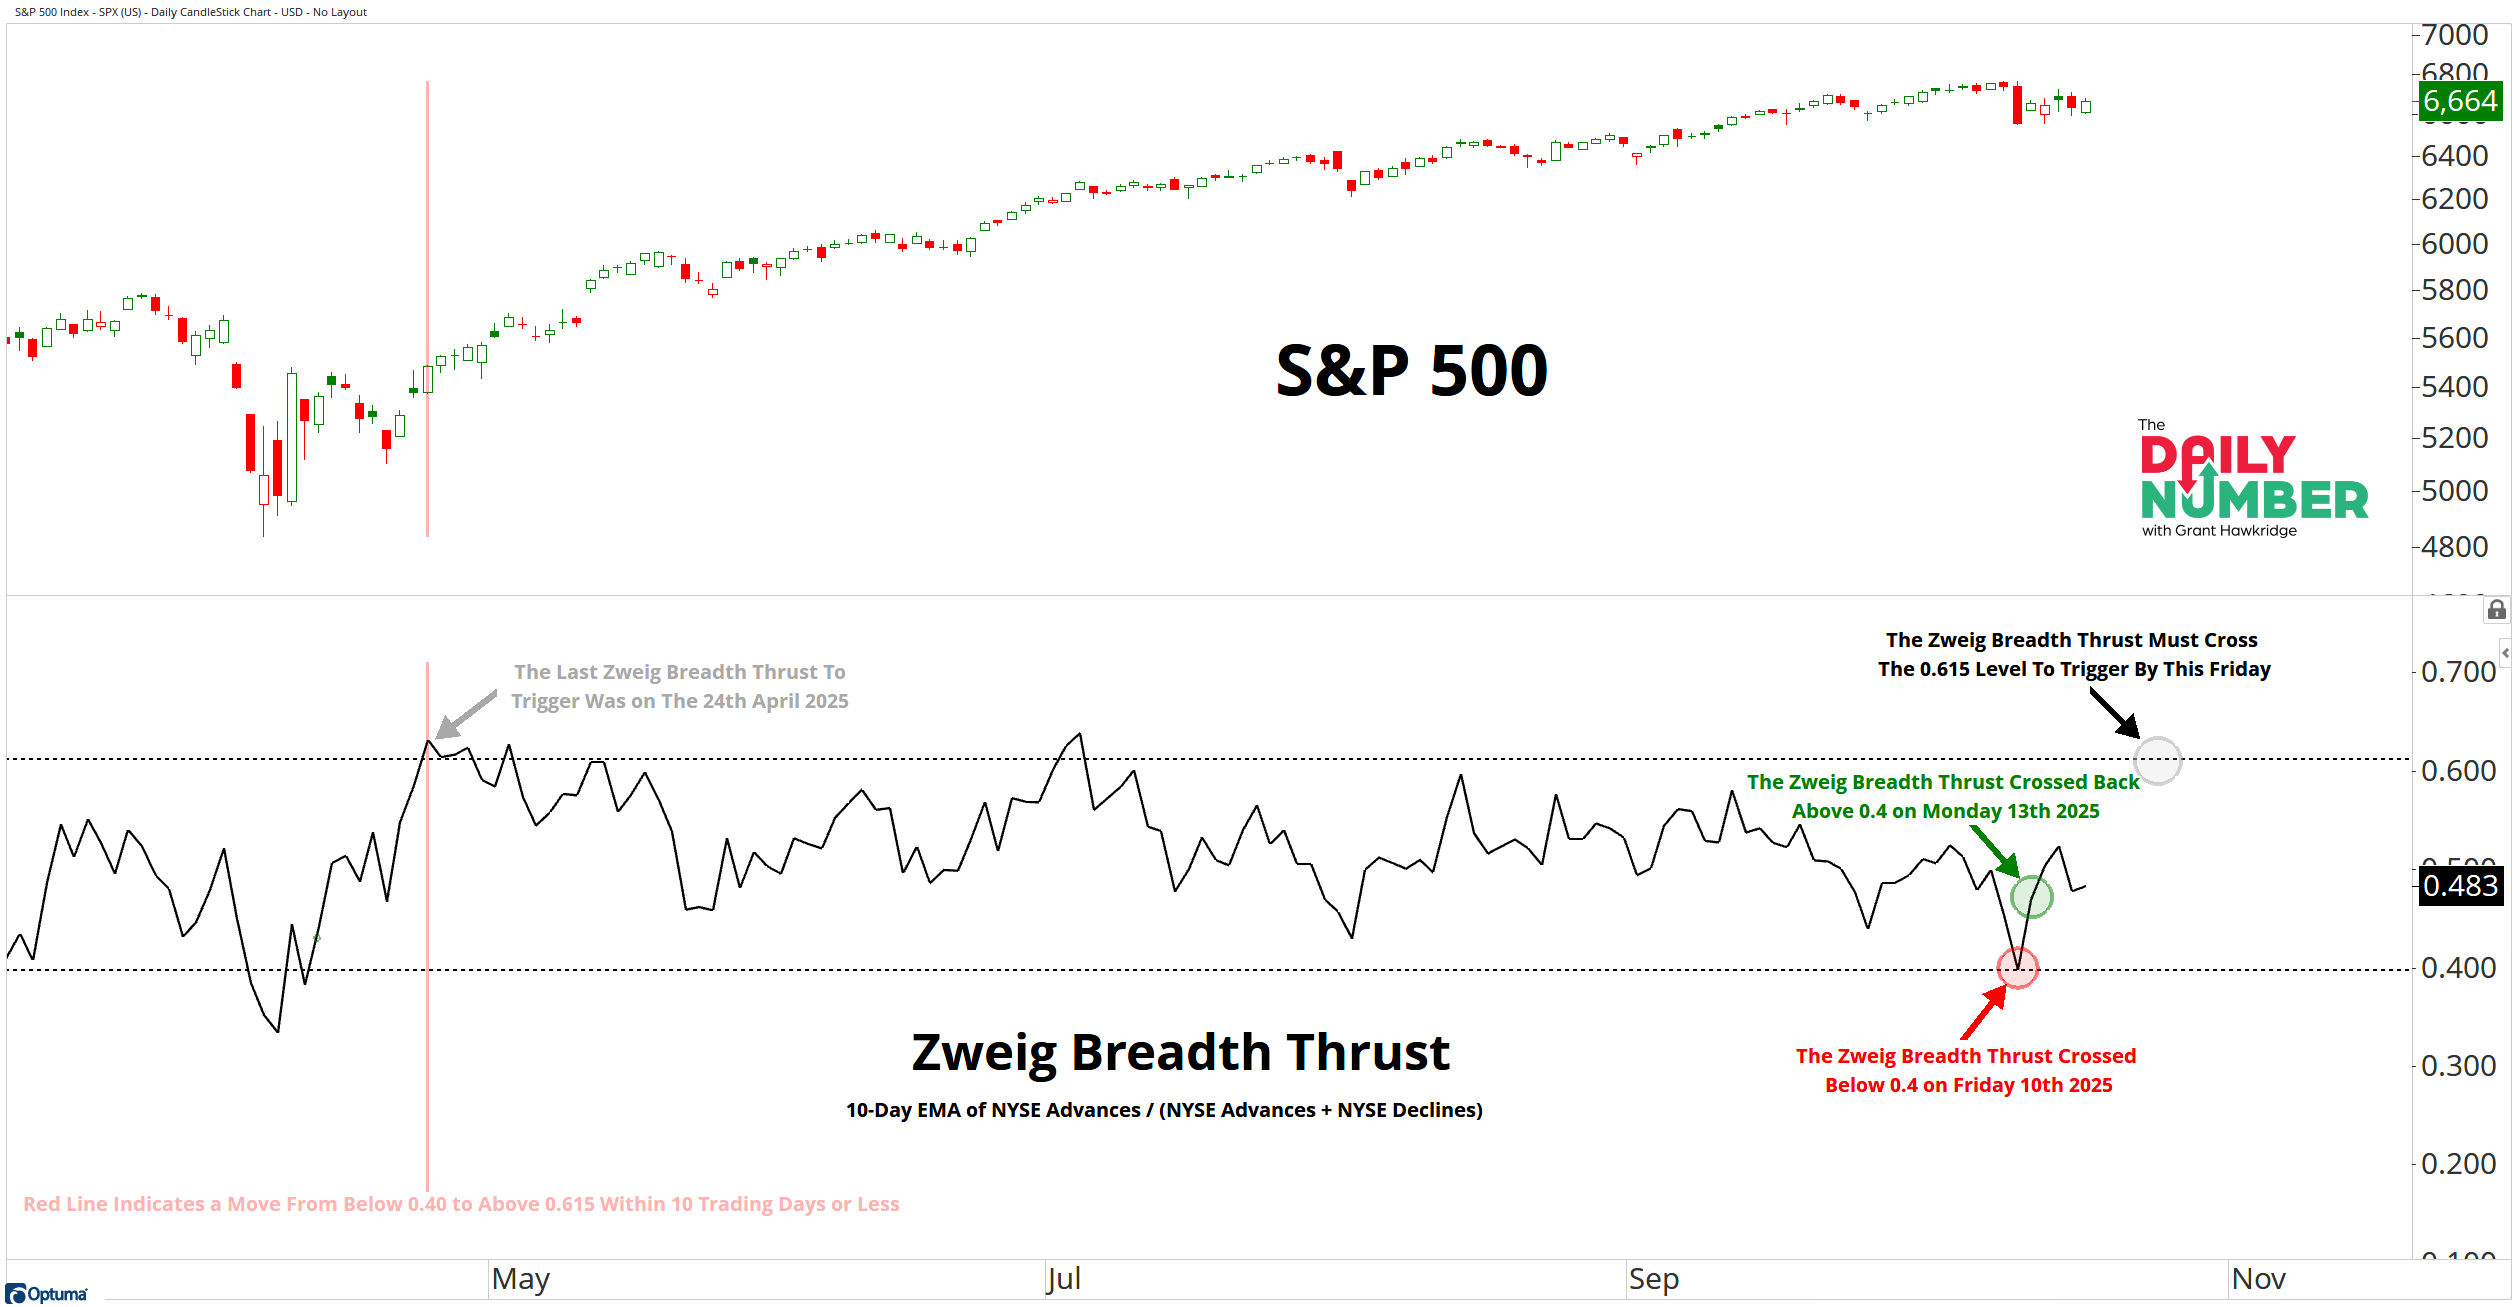
The top panel plots the S&P 500 daily close.
The lower panel tracks the Zweig Breadth Thrust in black.
The red marker shows when the indicator dropped below 0.40 on October 10th. The green marker marks its rebound above 0.40 on October 13th.
To confirm a new signal, it must rise above 0.615 within ten trading days.
The Takeaway: The clock is ticking for breadth.
Five days left to decide whether this rebound becomes a new thrust or just another failed attempt.
If the Zweig Breadth Thrust crosses 0.615 in time, it would confirm another rare surge in internal momentum and show that the bull trend still has fuel.
Across 18 historical triggers since 1950, the S&P 500 has gained an average of +20.3% after twelve months, with 94% of cases positive.
That’s not opinion… that’s strength!
It’s the kind of internal ignition that often powers the next leg of a bull market.
The April 2025 thrust kicked off the last major advance. A second one this close together would be rare and potentially explosive.
But if the ratio stalls below 0.615, it means buyers have lost urgency. The setup expires, leaving the market in a holding pattern instead of a full acceleration phase.
If it fires, the bears won’t like what comes next.
If you find my content valuable, I would greatly appreciate it if you could share it with your friends, family, and colleagues. Your help in spreading the word is invaluable in supporting our work. Thank you to all of you who share!