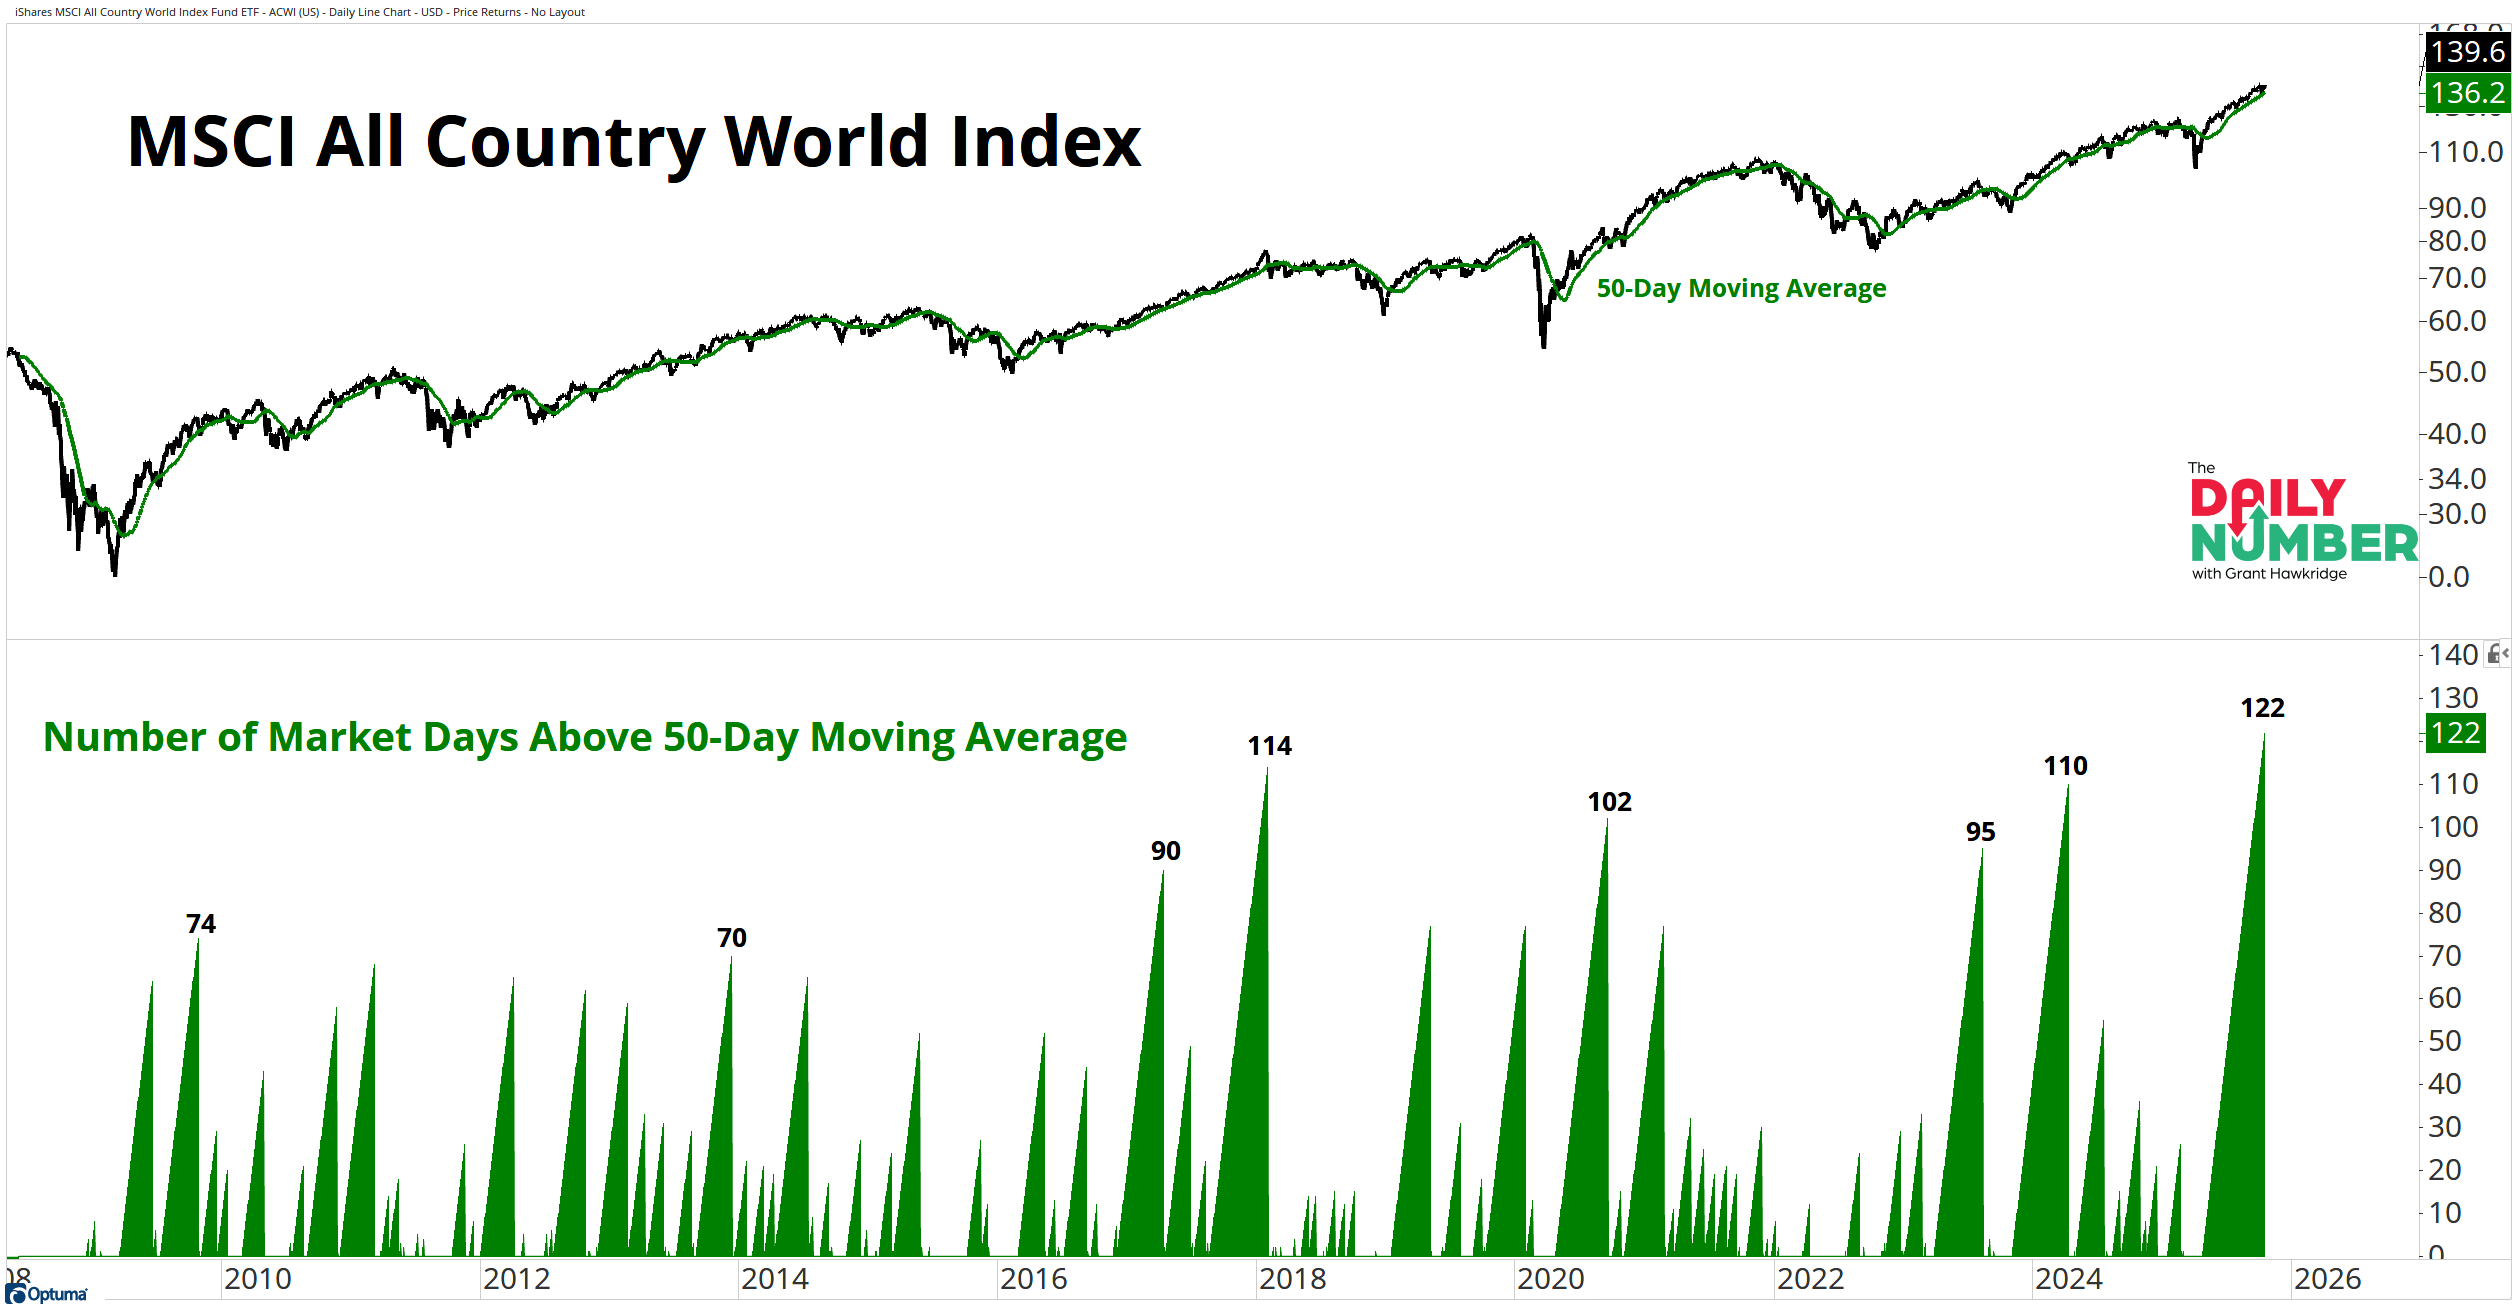
The MSCI All Country World Index has stayed above its 50-day moving average for 122 trading days. That’s the longest run of global strength in 15 years.
Here’s the chart:
Let's break down what the chart shows:
The top panel plots the MSCI All Country World Index in black, with its 50-day moving average in green.
The lower panel tracks the number of trading days per year where the index closed above its 50-day average.
The Takeaway: Global equities have now stayed above their 50-day average for 122 straight trading sessions.
That is the longest stretch in over 15 years. It reflects consistent strength, not a short burst of momentum.
This measure looks at time, not price. Time spent above trend often says more about a market’s strength than the size of its gains. Strong markets do not just move higher, they hold there. That is what this streak is showing.
When the world index holds up this long, it means weakness has been shallow, and buyers keep showing up.
The tape keeps confirming the uptrend.
Some past runs like this have paused without breaking the trend. Others have marked the start of bigger pullbacks.
The signal to watch is whether the 50-day moving average continues to hold as support.
For now, the global trend is still up. The test will come when that line stops holding.
If you find my content valuable, I would greatly appreciate it if you could share it with your friends, family, and colleagues. Your help in spreading the word is invaluable in supporting our work. Thank you to all of you who share!