That’s the average stock gain for Utilities since the NYSE new highs list peaked on September 11, 2025.
Here’s the chart:
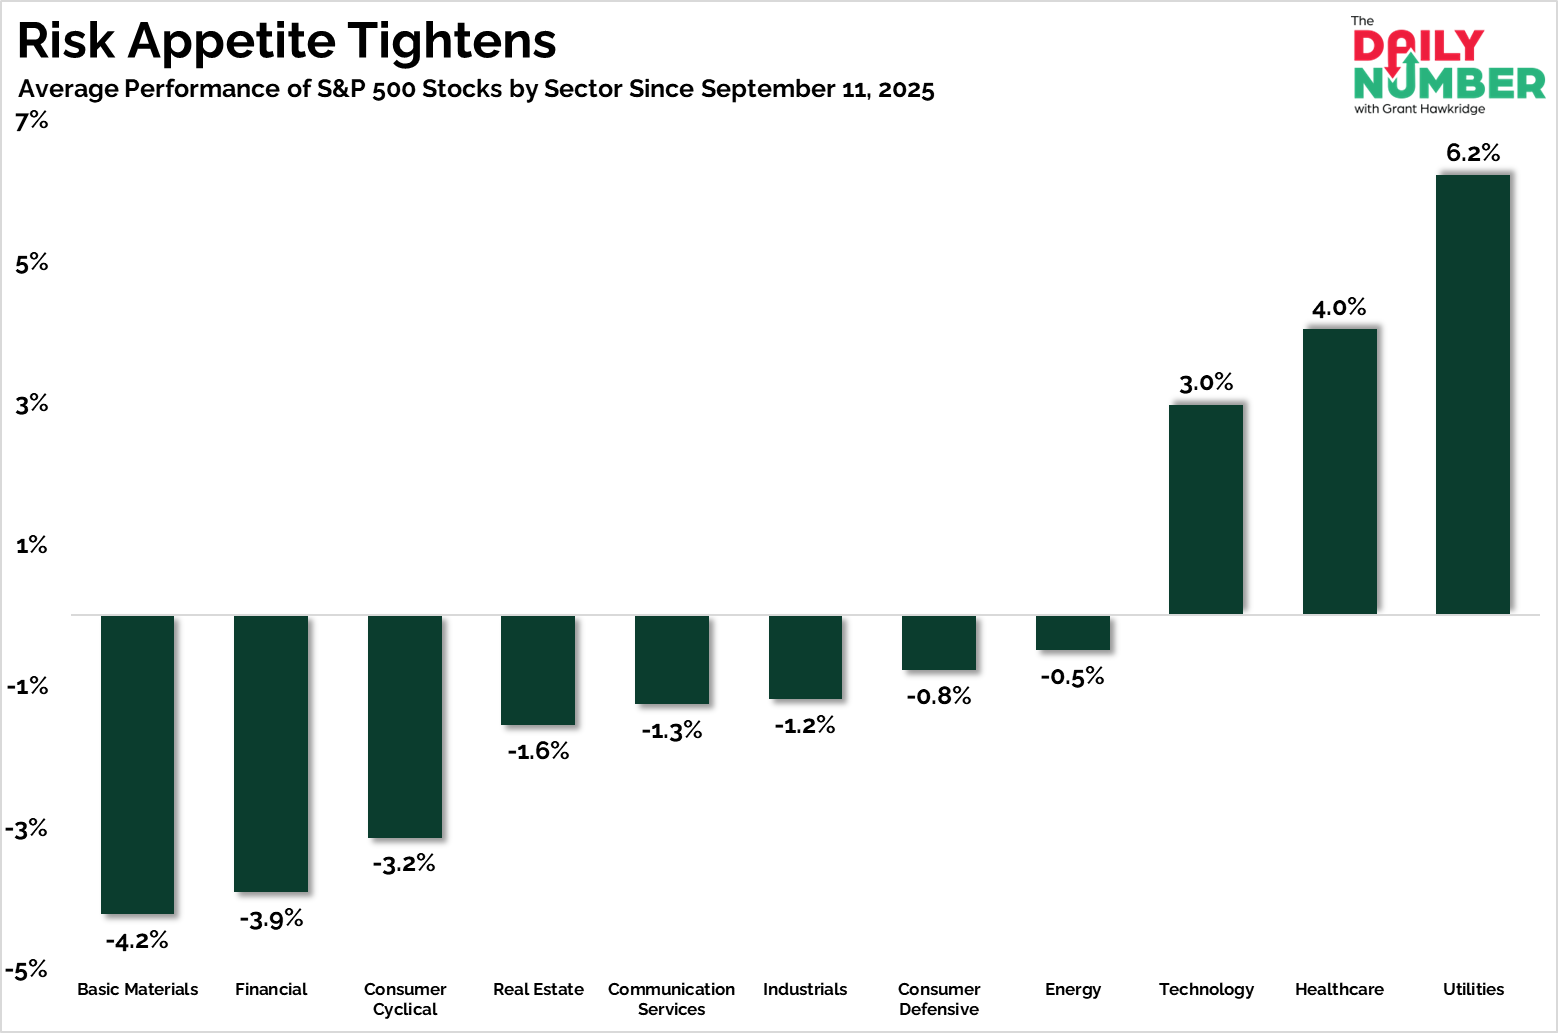
Let's break down what the chart shows:
The chart displays sector performance within the S&P 500 since the date when the NYSE's new highs peaked.
Each bar represents the average percentage change of S&P 500 stocks within a specific sector over that period.
The Takeaway: Since the NYSE's new highs peaked, leadership has flipped toward defensive stocks.
Utilities are up roughly 6%, Healthcare about 4%, while cyclical groups like Materials, Financials, and Consumer sectors have slipped between 3% and 4%.
That shift shows investors tightening exposure, not exiting the market.
It reflects a move toward stability, not fear, and a cooling of momentum after a long stretch of strength.
Breadth has narrowed, but price remains supported.
When defensives lead while major indexes hold above their 50-day averages, markets are usually consolidating within an ongoing bull, not breaking down.
Worth watching now is whether risk sectors start to recover or continue to lag.
If Financials and Cyclicals rebound, participation can broaden again. If not, the tape will likely grind higher more slowly as money hides in safer corners.
For now, the market is still healthy, just changing shape.
Will the next move come from risk catching up, or defensives giving way?
If you find my content valuable, I would greatly appreciate it if you could share it with your friends, family, and colleagues. Your help in spreading the word is invaluable in supporting our work. Thank you to all of you who share!